




About the Authors: Rick D. Longobart is Fleet Operations Manager for the City of Raleigh and a principal of Longobart-Ross Consulting Inc., with more than 40 years of fleet industry experience spanning public-sector fleet management, equipment replacement, lifecycle cost analysis, budgeting, and operational improvement. Cynthia Ross is President and Principal of Longobart-Ross Consulting Inc. and the company’s Project Manager, bringing expertise in strategic planning, equipment replacement software, cost management, and developing practical strategies that help fleets improve efficiency and achieve operational goals.
Building a Better Vehicle Replacement Model
Meter readings still matter, but engine hours, idle time, maintenance trends, and utilization can help fleets spot costly vehicles before the odometer does.
by Cynthia Ross and Rick Longobart | Longobart-Ross Consulting
September 22, 2026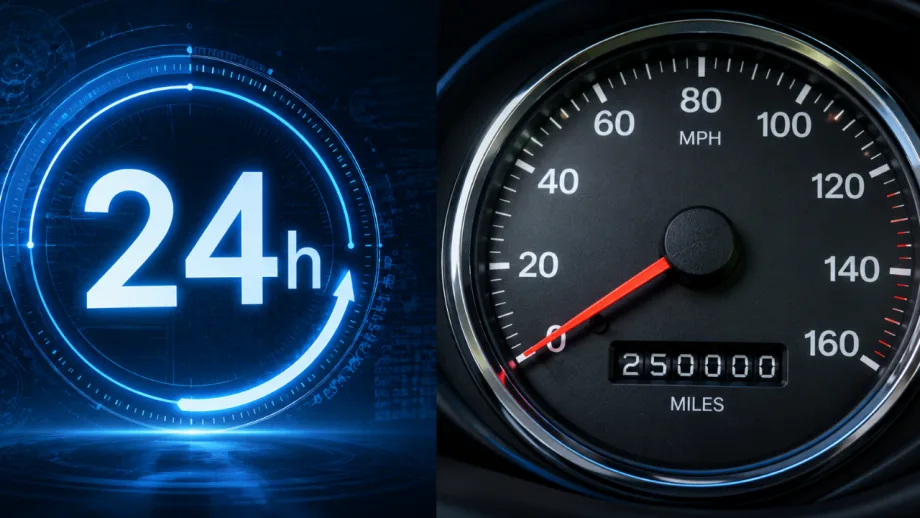
Mileage tells only part of the story. Comparing engine hours with odometer readings can give fleets a clearer picture of vehicle use, wear, and when to replace vehicles.
Credit:
Work Truck
12 min to read
- Besides meter readings, factors like engine hours and idle time are crucial for assessing vehicle replacements.
- Monitoring maintenance trends helps fleets identify vehicles that may become expensive liabilities.
- Utilization data enables proactive decisions to replace vehicles before high odometer readings dictate action.
*Summarized by AI
Editor’s note: This is Part 2 of a two-part series examining why meter reading alone may not fully reflect vehicle condition. Part 1 looked at the hidden wear created by idling, PTO use, stop-and-go routes, and severe-duty operation and the downward cost of excessive idling.
Once a fleet recognizes that meter readings don't tell the whole story, the next question is practical: What should replace them? The answer is not a single new metric.
Engine hours matter for vehicles that spend much of the day idling or powering equipment. Maintenance trends matter when repair costs begin climbing. Fault codes can reveal developing problems, while utilization data can show whether a vehicle is delivering enough value to justify keeping it.
Each measure fills in part of the picture. The goal isn't to build a complicated formula only an analyst can understand. It is to use the data the fleet already has to identify vehicles that deserve a closer look before repairs, downtime, total cost of ownership, and emergency replacement costs begin piling up.
Start With the Vehicle’s Job
A replacement model should reflect how the vehicle is used. That sounds obvious, but many fleets still apply the same mileage or age threshold across vehicles with very different assignments. A highway truck, utility vehicle, refuse unit, service van, and supervisor pickup do not accumulate wear in the same way. Even vehicles with the same year, make, and model may need different replacement criteria if their routes and workloads are different.
The first step is to group vehicles by duty cycle. Possible groups may include:
- Highway and long-distance vehicles
- Urban delivery and stop-and-go units
- Utility and PTO-intensive trucks
- Construction and field-service vehicles
- Emergency and public-safety vehicles
- Light-duty administrative or supervisory vehicles
The categories do not need to be perfect. They need to be specific enough that the fleet is comparing vehicles that perform similar work. Once those groups are established, the fleet can decide which measures deserve the most attention within each one.
Mileage may remain the leading indicator for a highway unit. Engine hours and idle percentage may matter more for a utility truck. Maintenance cost, fault activity, and downtime may carry significant weight across both.
Other factors that need to be taken into consideration for the correct use and replacement are the following:
- Right Typing – The Right Asset for the Task
- Right Sizing – Having the right amount of assets for the operation and,
- Right Fueling – the Right Fuel for the type of asset
Measure Idle Time in Context
Idle percentage and cumulative idle hours are among the most useful additions to a mileage-based replacement process. They are also easy to misinterpret. A high idle rate may indicate unnecessary engine use, but it may also reflect the vehicle’s job. A bucket truck powering hydraulic equipment, an ambulance supporting onboard systems, and a delivery van sitting outside a building are not idling for the same reason.
Fleets should separate productive idle from avoidable idle whenever the available data allows it. Productive idle may include time spent supporting:
- PTO-driven equipment
- Refrigeration
- Emergency lighting and communications
- Climate control needed for occupants, animals, medicine, or sensitive materials
- Hydraulic, pneumatic, or electrical tools
Avoidable idle may include extended warm-up periods, unattended vehicles left running, or engine use that could be reduced through driver coaching, policy changes, or auxiliary equipment. Both types contribute to engine hours, but they call for different responses.
Productive idle may need to be built into the vehicle’s maintenance and replacement plan. Avoidable idle may signal an opportunity to reduce fuel use and wear before replacing the asset earlier.
Compare Engine Hours With Mileage
Engine hours are most useful when reviewed alongside the odometer. A vehicle with high mileage and high engine hours may simply be heavily used. A vehicle with low mileage and unusually high engine hours may be spending much of its working life idling, operating at low speed, or powering equipment. That difference matters.
Fleets can calculate the relationship between engine hours and mileage for vehicles within the same duty-cycle group. Units that fall well outside the group’s normal range should be reviewed.
The goal is not to apply a universal conversion, such as treating every engine hour as a fixed number of miles. The mechanical effect of an hour varies by load, temperature, engine type, and application. Instead, use the relationship as an internal comparison. If five similar utility trucks have comparable mileage but one has significantly more engine hours, the fleet should ask why. That vehicle may be assigned to more demanding jobs, used more heavily for PTO work, or experiencing excessive idle time.
The answer may point to an earlier maintenance interval, a different replacement timeline, an equipment change, or an operational problem worth correcting.

A single repair bill does not always tell the full story. Tracking maintenance costs over time can reveal when a vehicle is moving into a higher-cost stage of its lifecycle and deserves a closer review.
Credit:
Work Truck | This image was edited with OpenAI, please refer to our Terms of Use.
Follow Maintenance Costs Over Time
A single repair bill does not always tell fleet managers much. A major repair may extend a vehicle’s useful life. At the same time, a series of smaller problems can make another vehicle increasingly expensive and unreliable, even if no individual invoice appears serious.
The trend matters more than the snapshot.
Fleets should track maintenance costs by vehicle over several reporting periods. Useful measures may include:
- Total maintenance cost
- Maintenance cost per mile
- Maintenance cost per engine hour
- Number of repair events
- Repeat repairs involving the same system
- Days out of service
- Road calls or unplanned failures
A vehicle whose costs have risen steadily over six or 12 months may be entering the high-cost stage of its lifecycle. That does not mean it must be replaced immediately. It means the vehicle deserves a review before another major repair is approved.
The fleet can then consider the vehicle’s operational importance, expected replacement lead time, residual value, and recent repair history. Without that trend data, replacement decisions often happen after a breakdown instead of before one.
Pay Attention to Repeat Problems
Repeat failures can be more revealing than total maintenance spending. A vehicle may continue returning to the shop for emissions-system faults, electrical problems, cooling issues, battery failures, or other related complaints. Each repair may be manageable on its own, but the pattern points to a vehicle that is becoming less dependable.
Fault-code data can help identify these patterns earlier. Modern telematics systems may capture diagnostic trouble codes before the driver reports a problem. Repeated codes involving the engine, aftertreatment system, transmission, or electrical system can provide an early warning that the vehicle is moving into a higher-risk phase.
The data is only useful if someone reviews it. A dashboard filled with alerts does not improve replacement planning unless those alerts are connected to work orders, repair history, and vehicle condition.
Fleets should focus on recurring or increasingly severe faults rather than treating every code as an automatic replacement signal. One isolated code may be noise. A recurring code paired with rising maintenance costs and downtime is a stronger reason to act.
Include Downtime in the Calculation
Maintenance costs are only part of what an aging vehicle costs the fleet. Downtime can create missed routes, delayed jobs, rental expenses, overtime, and pressure on spare vehicles. It can also affect customer service and employee productivity.
Those costs may never appear in the maintenance budget. A truck that needs frequent repairs but can be easily covered by a spare may cause limited operational disruption. The same repair pattern on a highly specialized vehicle may affect an entire crew.
Replacement decisions should therefore consider both repair cost and operational consequences.
Questions to ask include:
- How often is the vehicle unavailable?
- How long does each repair take?
- Is a spare available?
- Can another vehicle perform the same work?
- What happens to the operation when the vehicle is down?
- Are parts availability or diagnostic delays extending repair time?
A vehicle with moderate maintenance spending may still be a strong replacement candidate if its downtime creates an outsized problem.
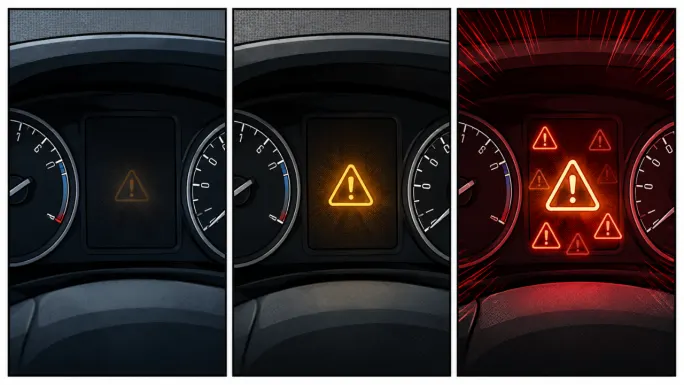
One isolated fault may not mean much, but recurring warning codes paired with rising maintenance costs or downtime can point to a vehicle becoming less dependable.
Credit:
This image was generated by OpenAI. Please refer to our Terms of Use.
Look at Utilization Before Replacing Anything
Not every aging vehicle needs a replacement. A unit may have low mileage, low engine hours, and few maintenance problems because it is rarely used. In that case, the better question may be whether the fleet still needs it. Utilization data helps fleets avoid replacing vehicles one for one simply because that is how the fleet has always operated.
Useful measures include:
- Days used per month
- Hours deployed
- Mileage compared with similar units
- Seasonal use
- Assignment frequency
- Time spent unavailable versus unused
A lightly used vehicle may be suitable for reassignment, pooling, or elimination. A heavily used vehicle may justify earlier replacement because it carries more of the workload and creates a larger gap when it is out of service.
Utilization also helps explain maintenance costs. A vehicle that appears expensive in total dollars may be economical when measured against how much work it performs. A lower-cost vehicle may be poor value if it spends most of its time parked.
Use Driver Data Carefully
Excessive idling directly skews an asset's lifecycle, often leading fleets to retire vehicles prematurely or retain severely worn assets past their optimal life. Because standard replacement schedules are typically triggered by meter readings, prolonged idling hides thousands of equivalent engine meter readings, where one hour of idle time equals roughly 25 to 30 miles of engine wear.
As a result, an asset with low mileage may possess the internal wear of a high-mileage vehicle, suffering from degraded oil, engine deposits, and failing emissions systems. By tracking engine hours alongside mileage to account for idle time, fleet managers can accurately predict the true point of economic repair, optimize replacement lifecycles, and avoid catastrophic component failures before an asset reaches its planned life expectancy.
Driver behavior data can add useful context, especially when vehicles show high idle rates, harsh braking, aggressive acceleration, or other demanding operating patterns.
But the purpose should be understanding, not assigning blame. A high idle percentage may reflect driver behavior. It may also reflect the route, equipment, weather, or work rules. Before assuming the driver is the problem, fleets should review:
- Whether the vehicle must be idle to support equipment
- Whether cab heat or air conditioning is needed for safety
- Whether route schedules create long waiting periods
- Whether anti-idling equipment is available and working
- Whether the driver has been trained on the policy
- Whether the policy is realistic for the job
In some cases, coaching may reduce unnecessary idling. In others, the fleet may need to change the vehicle specification, add auxiliary power, or revise the operation. Driver data works best when it helps explain why a vehicle is aging faster than its peers.
Build a Scorecard That People Can Use
Some fleets combine several measures into a single replacement score. That can be helpful, but the model should remain understandable. A score might include:
- Age
- Mileage
- Engine hours
- Idle percentage
- Maintenance cost trend
- Repeat fault activity
- Downtime
- Utilization
- Residual value
- Condition
- Reliability
- Severity of Service
The weight assigned to each measure should reflect the vehicle group. For a highway truck, mileage and maintenance cost may carry more weight. For a utility truck, engine hours, idle time, PTO use, and downtime may matter more.
The score should identify vehicles that need review, not make the decision automatically. A unit may score poorly but remain essential because a replacement is not yet available. Another may score moderately but be removed early because it is unreliable, lightly used, or expensive to support.
Fleet judgment still matters; the model simply makes that judgment more consistent and easier to explain.
Review the Plan Regularly
Don't set replacement schedules once and forget them. Vehicle condition, usage, repair costs, budgets, and lead times change. A vehicle expected to remain in service for another year may begin experiencing repeat failures. Another may remain reliable well beyond its planned replacement point.
Quarterly or semiannual reviews give fleets a chance to adjust.
A practical review can focus on vehicles that:
- Are approaching the planned replacement window
- Have rising maintenance costs
- Show unusual engine hours or idle rates
- Have repeated faults
- Experience frequent downtime
- Are significantly underused
- Are difficult or expensive to support
The fleet does not need to reevaluate every vehicle from scratch each quarter. It needs a repeatable way to identify the units whose condition or use has changed. That keeps the replacement plan connected to what is actually happening in the field.
Connect Replacement Timing to Total Cost
The final replacement decision should consider total cost of ownership. That includes more than acquisition and maintenance. It may also include:
- Fuel or energy
- Downtime
- Rental or spare-vehicle costs
- Technician labor
- Parts availability
- Residual value
- Administrative and registration costs
- The operational cost of an unreliable vehicle
At some point, the cost of keeping an aging vehicle exceeds the cost of replacing it. That crossover point is not always easy to calculate precisely. Replacement lead times, interest rates, vehicle availability, and budget limitations can all complicate the decision.
Even an imperfect calculation is better than relying on mileage alone. A vehicle with rising repair costs, falling residual value, repeated downtime, and high operational importance may need to leave service before reaching the traditional mileage threshold.
Another vehicle may remain economical longer because it is reliable, lightly stressed, and inexpensive to maintain.
Electrification Requires Different Measures
Battery-electric vehicles remove many of the concerns associated with combustion-engine idling. There is no engine oil to degrade, no diesel particulate filter to regenerate, and no combustion engine accumulating hours while the vehicle sits.
Mileage, however, still does not tell the full story. Battery state of health becomes one of the most important lifecycle measures. Battery condition can be affected by:
- Charge cycles
- Depth of discharge
- Fast-charging frequency
- Thermal management
- Ambient temperature
- Accessory use
- Time spent at very high or low states of charge
A higher-mileage EV with strong battery health may remain well suited for service. A lower-mileage unit with more battery degradation may struggle to complete its route. Electric vehicles also continue consuming energy while parked when supporting climate control, refrigeration, lighting, communications, battery conditioning, or other equipment.
That is not engine idling, but it affects range, charging demand, and vehicle suitability. As fleets add electric and hybrid vehicles, replacement plans will need to include powertrain-specific measures rather than applying the same model to every asset.
Keep the Process Practical
A better replacement model does not require perfect data. Start with the vehicle groups where mileage is most likely to be misleading. That may include utility trucks, emergency vehicles, service units, refuse trucks, and vehicles with heavy PTO use.
For those units, review:
- Age and mileage
- Engine and idle hours
- Recent maintenance trends
- Repeat faults and downtime
- Utilization
- Operational importance
- Residual value
- Replacement availability
That review may confirm the existing replacement date. It may also show that one vehicle should leave earlier while another can remain in service without creating unnecessary risk. The value comes from making those decisions deliberately.
Move Beyond a Single Number
Mileage will remain part of fleet replacement planning. It is familiar, accessible, and useful. It should no longer be expected to make the decision on its own. Engine hours help show how long the vehicle has been working. Idle data helps explain how it has been used. Maintenance trends show whether costs are beginning to climb. Fault activity and downtime reveal reliability concerns. Utilization shows whether the asset is delivering enough value to keep or replace.
Together, those measures create a more realistic picture of vehicle condition. Most fleets already collect much of this information. The opportunity is to use it consistently, compare similar vehicles, and act before a high-cost unit forces the decision through a breakdown.

Credit:
Work Truck | Longobart-Ross Consulting Inc.
Quick Answers
Meter readings remain useful, but they should be considered alongside engine hours, idle time, maintenance trends, downtime, and utilization to provide a more complete picture of vehicle condition.
*Summarized by AI
Subscribe to Our Newsletter
More Remarketing & Lifecycle

AP Fleet Management Expands Remarketing Program for Commercial Work Trucks
AP Fleet Management expanded its commercial vehicle remarketing program with dedicated resale services and an online marketplace for used work trucks.
Read More →
What Actually Makes a Truck Reliable for Fleets?
What makes a truck reliable for fleets? From uptime to maintenance and spec’ing, here’s what really drives performance, and where fleets can weigh in.
Read More →
REP Inspection Services Launches, Delivering Professional Equipment Inspections
REP Inspection Services, led by someone with more than 30 years of industry experience, has launched its professional inspection services for trucks, trailers, and equipment across the commercial vehicle industry.
Read More →

Introducing Work Truck’s 2025 Remarketing Report Series
Work Truck’s 2025 Remarketing Report Series uncovers how data, timing, and technology are reshaping resale value and driving smarter fleet strategies.
Read More →
Fleet Remarketing Outlook 2026: EVs, Policy, and the Power of People [Part 4]
From EVs to policy changes, the 2026 fleet remarketing outlook is all about people, progress, and finding opportunity in stability.
Read More →
Digital Fleet Remarketing: How Tech and Transparency Build Buyer Confidence [Part 3]
Technology and trust are reshaping fleet remarketing in 2025. See how data, transparency, and partnerships drive better resale outcomes.
Read More →
Fleet Replacement Strategy 2025: When to Hold and When to Fold [Part 2]
Knowing when to sell or hold is key in 2025. Discover how fleet professionals use data and TCO insights to make smarter remarketing calls.
Read More →
The 2025 Work Truck Remarketing Market: Prices, Pressure, and What Comes Next [Part 1]
Fleet remarketing in 2025 is stabilizing. Experts share how prices, rates, and new tech are shaping used truck values and resale strategies.
Read More →
Copart and One Inc. Partner to Improve Auto Claims Process
ChatGPT said: One Inc and Copart partner to speed up lienholder payments, helping insurers process total loss vehicle claims faster and improve customer experiences.
Read More →
Fleet Remarketing Industry Council Launches to Shape Future Resale Value
What if fleets could shape how their vehicles are valued after resale? Now they can.
Read More →