





In 2026, Safety Will Stop Being a Program and Become How Fleets Operate
Research: U.S. Pedestrian Deaths Fall 11% in First Half of 2025
Vehicles struck and killed 3,024 people walking during the first half of 2025, an average of 16 per day, which is an 11% decline from the same period the year before, according to the Governors Highway Safety Association.
March 25, 2026
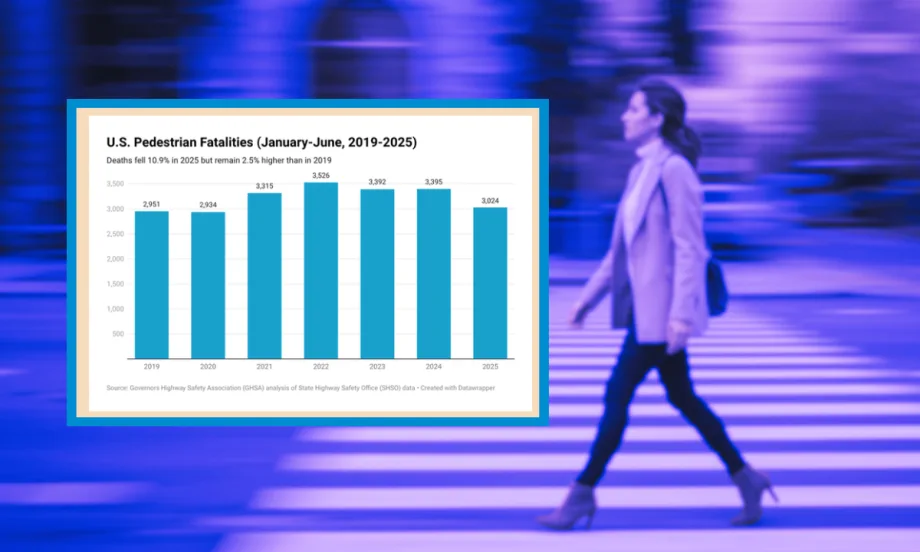
The 10.9% drop in pedestrian deaths from 2024 to 2025 (January-June) is the largest decrease since the Governors Highway Safety Association began publishing these reports 15 years ago.
Credit: GHSA/Work Truck
4 min to read
Drivers struck and killed 3,024 people walking during the first half of 2025, an average of 16 per day, according to a new data analysis from the Governors Highway Safety Association (GHSA). That is an 11% decline from the same period the year before, the largest drop since GHSA began tracking pedestrian fatalities 15 years ago.
While GHSA said this recent safety momentum is positive, pedestrian deaths remain above the 2019 level, the last year before a steep rise in dangerous driving behaviors and traffic deaths caused by the pandemic.
“Each pedestrian death is so much more than just a number,” said GHSA Chief Executive Officer Jonathan Adkins. “Each one is a family member, friend, or neighbor that no one will be able to hug, see, or share time with ever again. While we are pleased with the progress shown in the data, the only acceptable number of traffic deaths is zero.”
What the Data Shows
An in-depth examination of original data GHSA collected from State Highway Safety Offices (SHSOs) across the country found that:
The 10.9% drop in pedestrian deaths from 2024 to 2025 (January-June) is the largest decrease since GHSA began publishing these reports 15 years ago. This translates into 371 fewer pedestrian deaths than in the same period the prior year.
However, this is still 2.5% higher than pre-pandemic levels (2,951 in January-June 2019).
The pedestrian fatality rate measured per 100,000 population fell to 0.90 in 2025 – the lowest mark since 2020. Measured by vehicle miles traveled (VMT), there were 1.86 fatalities per billion VMT, the lowest since 2019.
Financial Cost of Pedestrian Deaths
In addition to the lasting emotional trauma caused by a pedestrian being killed, there is a high financial cost to each death. The total financial cost of all 3,024 fatalities from January through June 2025 combines to exceed $40 billion.
States with Decreased Deaths
Pedestrian fatalities increased in 24 states, decreased in 23 states and D.C, and remained the same in three states for January-June from 2024 to 2025.
Decreases in states including Alabama, California (-32%), Maryland, New Mexico, and New York drove the nationwide count down from 2024, even though there were the same number of states (plus D.C.) that posted an increase and a decrease.
“Access to timely, high-quality data is essential to understanding and helping prevent roadway fatalities,” said Anderson Abernathy, president and COO of Michelin Mobility Intelligence. “We are encouraged by the progress reflected in this report, but the data also reinforces the need for continued collaboration across public and private sectors to improve safety for all road users, especially pedestrians. At Michelin we believe that integrating advanced analytics with cross-sector collaboration can help identify risk patterns earlier and enable more targeted interventions. Turning insight into impact is essential to the USDOT’s Safe System Approach designed to enhance safety for all road users.”
Improving Pedestrian Safety & Saving Lives
Methods to improve pedestrian safety suggested by GHSA include:
Minimizing pedestrians’ exposure to vehicles (particularly on high-speed roadways)
Prioritizing visibility between drivers and pedestrians
Managing speed and enforcing speed limits
Using new technology and data to identify and address challenges
Promoting safe road use through education and enforcement
Improving post-crash care
Using both traditional crash databases and innovative new data sources to learn from fatalities and injuries can also inform safety plans, countermeasures, and policy.
First Look at Pedestrian Fatality Trends
GHSA’s report provides a first look at the pedestrian fatality trends well before the National Highway Traffic Safety Administration’s (NHTSA) Fatality Analysis Reporting System (FARS) data are available.
It presents individual data for all states as well as projected pedestrian fatality rates per population, at both state and national levels, and per vehicle miles traveled at the national level.
Full-Year Projections Available Later This Year
Later this year, GHSA will publish the full-year 2025 pedestrian fatality projections based on state data, which will also include an analysis of the 2024 national FARS data.
FARS provides additional insights on why, where and how drivers strike and kill people walking. This forthcoming report will also summarize promising state and local approaches to protect pedestrians on U.S. roadways.
Steve Jackson and Paula Raymond of toXcel conducted the data analysis and authored the report. Michelin Mobility Intelligence provided financial support for the report’s production but did not provide editorial direction or review content.
More Safety

When Work Trucks Under 26,001 Pounds Need IRP Registration
Think trucks under 26,001 pounds are automatically in the clear when it comes to IRP? Not always. Learn where lighter vehicles can still run into trip permit, apportioned registration, and IFTA compliance requirements when crossing state or provincial lines.
Read More →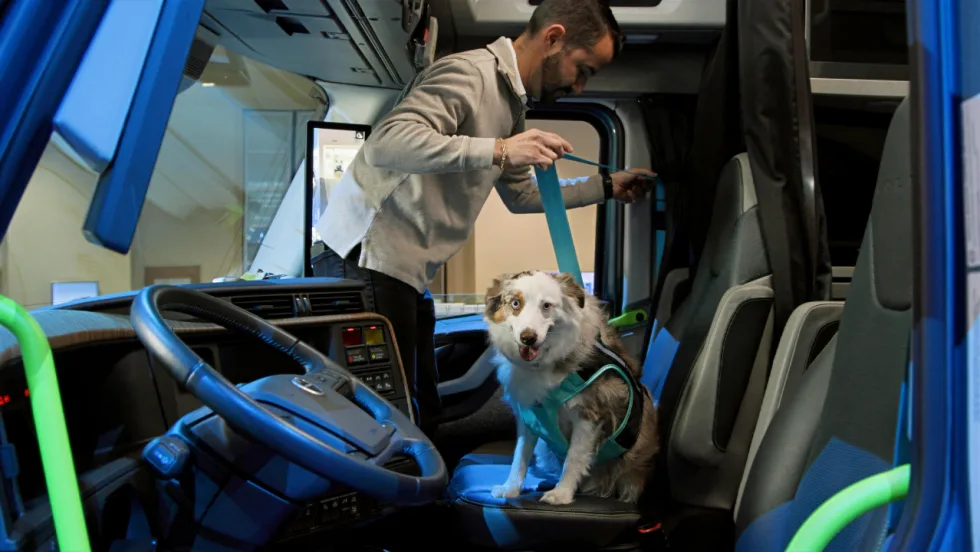
Volvo Trucks Releases New Safety Recommendations for Traveling with Pets
One of the most important recommendations for professional drivers traveling with pets is to ensure pets are properly restrained while the truck is moving. Other tips are available in the new guide from Volvo Trucks North America and Center for Pet Safety.
Read More →
API Issues Refueling Safety Guidelines
The American Petroleum Institute offers a list of safe vehicle refueling guidelines, including ways to avoid potential problems with static electricity discharges in fall, winter, and early spring.
Read More →
Winter Fleet Prep: Expert Tips to Keep Vehicles Running Smoothly
Cold weather can expose weak batteries, tires, fuel systems, and maintenance gaps fast. Use this winter fleet checklist to prepare trucks and drivers before temperatures drop.
Read More →
When a Work Truck Breaks Down, the Job Can Stop, Too
A work truck breakdown can stop more than the vehicle. Discover how payloads, jobsites, and specialty equipment change the roadside response.
Read More →
What Stronger Long-Term Fleet Service Partnerships Actually Require
Fleet service partnerships rarely fall apart all at once. Learn the three warning signs that trust is eroding and what fleets and providers can do before downtime, frustration, and lost revenue follow.
Read More →
Applause & TRUCE Software Partner to Improve Driver Safety Through AI-Powered Telematics & Employee Performance Management
Applause has integrated TRUCE driving metrics directly into its employee-first performance and safety platform that transforms mobile devices into AI-powered telematics.
Read More →
How Detroit Assurance with Active Brake Assist Works
Do you want to see what it is like to experience Detroit Assurance’s Active Brake Assist? In this video, Work Truck will put you in the cab to see how it all works and then hear more details from DTNA’s Mike Young.
Read More →
Get Left of Loss: A 5-Step Workplace Violence Prevention Framework for Fleet Operators
Violence risks do not stop at the driver’s door. Learn five practical steps fleets can take to spot threats early and protect workers before loss occurs.
Read More →
Sponsored•July 17, 2026
How Better Visibility Cut Speeding Violations by 48%
Fleet leaders don't need more data, they need clearer visibility into what the data is saying. This case study explores how one utility replaced speeding-event counts with a single metric — miles driven in violation — to strengthen safety and significantly reduce speeding violations.
Read More →