




Author bio: Robert Hall, Jr., leads Track Your Truck, Inc. as Vice President of Sales and Marketing. He is passionate about helping companies optimize operations with advanced fleet tracking software while providing friendly support and an easy user experience. This article was authored and edited following Work Truck editorial standards and style. Opinions expressed may not reflect those of WT.
What Fleet Managers Should Measure Beyond Vehicle Location
Knowing where your trucks are is only part of managing fleet performance. From vehicle utilization and fuel costs to driver behavior and downtime, these seven key metrics can help smaller fleets identify inefficiencies and make better decisions without getting buried in data.
by Robert Hall, Jr., Track Your Truck
November 19, 2026
Knowing where your trucks are is only part of the fleet management picture. Tracking vehicle utilization, fuel consumption, maintenance costs, and driver behavior can help fleet managers better understand performance and identify opportunities for improvement.
Credit:
Work Truck
8 min to read
- Fleet managers should go beyond tracking vehicle location to enhance performance.
- Key metrics include vehicle utilization, fuel costs, driver behavior, and downtime.
- Smaller fleets can identify inefficiencies without overwhelming data analysis.
*Summarized by AI
Do you know where your trucks are?
It’s an age-old fleet management question. And while it’s certainly important for dispatching, routing, communication, and visibility, it still only captures a limited perspective of fleet performance.
For a full picture, other questions need to be asked: Are all vehicles being used efficiently? Are drivers creating avoidable risks? Is fuel being wasted? Are maintenance problems more frequent? How much productive time is lost?
However, smaller fleets don’t need dozens of KPIs for truck tracking; they benefit most from a focused set of metrics that show where costs, risk, and lost capacity come from.
Let’s break down the biggest factors behind fleet performance.
1. Vehicle Utilization: Are You Getting Enough Value from Every Asset?
Fleet size alone doesn't tell you whether you have the right number or mix of vehicles. Utilization lets managers see which vehicles are heavily used and which sit idle for long stretches.
Simply put, utilization is vehicle use compared to vehicle availability. Follow this basic formula:Vehicle utilization = vehicle usage ÷ vehicle availability.
Each fleet has different demands, so you can measure usage by miles driven, engine hours, hours or days in active service, jobs completed, or another data point that best fits the business.
For vocational fleets, mileage is usually misleading; utility trucks, landscaping vehicles, or heavy equipment can still be productive while accumulating relatively few road miles. This consideration makes it crucial to compare similar vehicles performing similar tasks.
If vehicle utilization is lower than expected, a few common culprits tend to be at play. Low utilization can point to excess fleet capacity, poorly assigned vehicles, shifts in seasonal demand, or a vehicle that’s ill-equipped for the work. With that in mind, you need to dig deeper to find the real root cause.
And although low utilization isn’t ideal, the opposite can also create challenges. If utilization is regularly high, wear accelerates, too, leaving little backup capacity when a vehicle goes down.
Handled properly, vehicle utilization helps management right-size fleets, reassign assets, plan replacements, make capital-purchase decisions, and balance workloads.
2. Idle Time: How Much Engine Time Does Not Produce Useful Movement?
It may seem minor day to day, but across the full fleet, idling can become a significant factor.
Idle time is when the engine is on, but the vehicle is stationary. This is the most useful way to track it: Idle percentage = total idle time ÷ total engine hours × 100
This is why managers should monitor fuel consumption, engine wear, operating costs, and driver habits, organizing patterns by vehicle, route, and time of day.
But as with any decision, context matters, because not all idling is inherently wasteful; PTO-equipped vehicles, heating or cooling needs, job-site regulations, and specialty work can all warrant it. For this reason, separate productive and nonproductive idle time.
Instead of setting an arbitrary zero-idling target, the most realistic goal is to find avoidable patterns.
Want to see what idling might be costing your fleet? Plug your numbers into the calculator below to estimate monthly fuel use and costs, then consider how much of that idle time could realistically be reduced.
What Is Truck Idling Costing Your Fleet?
Estimate how much fuel and money your fleet uses while idling.
ESTIMATED MONTHLY IDLING FUEL COST
$990
Fuel used per month
264 gallons
Annualized fuel cost
$11,880
Estimates are based on your inputs. Fuel burn varies by vehicle, engine, PTO operation, and conditions. Not all idling is avoidable. Annual estimates assume the same monthly activity for 12 months.
Calculator results are estimates for educational purposes only. Verify all figures against your fleet records and consult qualified professionals before making business decisions.
3. Fuel Efficiency: Track the Trend, Not Just the Bill
It’s not uncommon for total fuel spend to be volatile, moving along with fuel prices and workloads and further shaped by mileage, vehicle condition, and driver behavior. For a clearer point of view, fuel efficiency separates those competing factors.
This is the most standard measure: Fuel economy = total miles driven ÷ total gallons consumed.
Several factors can impact fuel economy. Idling, aggressive acceleration, speed, road conditions, terrain, vehicle load, and mechanical condition are all common drivers, among others.
Instead of sounding the alarm after a day of low MPG, track trends over time. If one vehicle is declining more gradually than its counterparts, it could be due to maintenance mistakes, tire issues, changed duty cycles, or driving habits.
Another pro tip: pair MPG with cost per mile, idle time, and utilization before drawing conclusions.

Fuel expenses, maintenance costs, vehicle utilization, and driver behavior all affect fleet performance. Tracking the right metrics can help fleet managers identify hidden costs, reduce downtime, and make better operational decisions.
Credit:
Work Truck
4. Driver Behavior: Break Patterns Before They Become Problems
If you’re reading crash records, the damage is already done. But if you’re monitoring driver-behavior metrics, you can nip bad habits in the bud before they ever cause an accident.
When assessing driver behavior, pay close attention to things like speeding, harsh braking, rapid acceleration, aggressive cornering, or repeated high-RPM operation. And rather than relying on raw event totals, it’s recommended to normalize the data:
- Speeding event rate = speeding events ÷ miles driven or driving hours
- Harsh-driving event rate = harsh events ÷ miles driven or driving hours
Why does this matter? Someone covering 2,000 miles will naturally have more opportunities for an event than someone just covering a few hundred miles. With these rates, you can unlock more useful comparisons between different drivers.
Management can use this information to separate recurring behaviors from isolated events, identify coaching opportunities, see whether coaching changes the trend, and compare driver behavior with fuel use and vehicle wear, as applicable.
5. Maintenance Compliance and Downtime: Measure Vehicle Availability, Not Only Repair Cost
There are two sides to the coin of maintenance performance: whether preventive work happens on time and how long vehicles are unavailable when they’re being repaired. These formulas are designed to help: Preventive maintenance compliance = completed scheduled services ÷ total scheduled services
Schedule maintenance by mileage, engine hours, or manufacturer intervals. You also need to track missed or overdue services and identify vehicles that repeatedly fall behind schedule.
Mean time to repair (MTTR) = total repair time ÷ number of repairs
Rising repair time likely reflects parts delays, shop bottlenecks, recurring mechanical problems, aging vehicles, or poor repair coordination.
Other supporting measures include maintenance cost per vehicle, unscheduled repairs, downtime, diagnostic trouble codes, and repeat repairs. For SMB fleets, downtime matters as much as the repair cost, as losing one truck from a 10-vehicle operation immediately removes 10% of your units.
One truck in the shop might not sound like much until you look at what it means for the rest of your fleet. Use the calculator below to estimate how vehicle downtime affects fleet availability and the potential revenue at risk.
What Is Vehicle Downtime Costing Your Fleet?
Estimate how trucks out of service affect fleet capacity and potential revenue.
FLEET CAPACITY UNAVAILABLE
10.0%
Vehicle-days lost
3
Potential revenue at risk
$2,250
Estimates assume unavailable vehicles would otherwise be working during the days entered. Revenue at risk is not confirmed lost revenue or profit. Work reassignment, rentals, and recovered jobs may reduce the financial impact.
Calculator results are estimates for educational purposes only. Verify all figures against your fleet records and consult qualified professionals before making business decisions.
6. Productivity Metrics: Is Vehicle Activity Translating Into Completed Work?
While the miles driven and the engine hours both measure activity, fleet managers still need to see whether that activity produces meaningful work.
These are some of the most typical vocational-fleet metrics:
- Jobs completed per day
- Jobs completed per vehicle
- Time on the site
- Travel time between jobs
- Stops per route
- Service completion rate
- On-time arrivals
- Route completion
- Miles per completed job
A vehicle can show high utilization while operating inefficiently. High utilization with low efficiency can result from too much drive time between jobs, excessive dwell time, poor geographic scheduling, jobs completed out of sequence, or vehicles carrying heavier workloads than others.
7. Cost Per Mile: Create a Common Financial Benchmark
Individual metrics show managers what’s happening operationally, but cost per mile translates those figures into financial performance.
Basic formula: Cost per mile = total operating costs ÷ miles driven
Though this depends on the records you have, operating costs can include fuel, maintenance, repairs, tires, leasing/depreciation, insurance, and other vehicle-specific expenses.
Importantly, cost per mile cannot be evaluated in isolation. For instance, a specialty work truck might have a high cost per mile, but it can also create substantial value while sitting stationary at a site. Always compare similar vehicles and functions, along with each vehicle's historical trends.
Use unexpected increases in cost per mile to investigate fuel, maintenance, utilization, or downtime data.
What does it actually cost to keep your trucks on the road? Enter your fleet's mileage and operating expenses into the calculator below to estimate your cost per mile and see where your money is going.
What Does Each Mile Cost Your Fleet?
Enter monthly mileage and operating expenses for one vehicle or a group of comparable trucks.
ESTIMATED COST PER MILE
$0.92
Total monthly operating costs
$2,300.00
Where Your Money Goes
Use expenses and mileage from the same period. Include either lease payments or depreciation, not both. These estimates reflect only the costs entered. For vocational vehicles with limited road mileage, cost per engine hour or completed job may provide a more useful comparison.
Calculator results are estimates for educational purposes only. Verify all figures against your fleet records and consult qualified professionals before making business decisions.
8. Build a Scorecard Small Enough to Use
While the main takeaway here might seem to be “track everything,” that couldn’t be further from the truth, especially for SMB fleets. In fact, it’s best to begin with five to seven metrics tied to current priorities.
If the main concern is cost control, then track fuel economy, idle percentage, and cost per mile. If safety is the superior focus, monitor the speeding-event rate and harsh-driving-event rate. For fleet capacity, review utilization, downtime, and jobs per vehicle. If reliability is the top priority, track PM compliance, MTTR, and unscheduled repair frequency.
For each metric, follow this process:
- Establish a baseline.
- Compare similar vehicles and drivers.
- Set a realistic target.
- Assign responsibility for follow-up actions.
- Review trends on a regular basis.
- Measure whether interventions worked.
Turn Fleet Data Into Better Decisions
Vehicle location is valuable, but it’s even more important for managers to know a vehicle is productive, safe, and reliable. Combine utilization, fuel efficiency, driver behavior, maintenance, downtime, and productivity to paint the full picture, but smaller fleets should still avoid dashboard overload by focusing on a select few KPIs.
Ultimately, fleet data is just data until managers act on it, and that’s where the true value comes from.

Credit:
Track Your Truck | Work Truck
Quick Answers
While knowing vehicle location is crucial, it doesn't provide a comprehensive view of fleet performance. Other metrics like vehicle utilization, fuel costs, driver behavior, and downtime offer deeper insights into efficiency and areas for improvement.
*Summarized by AI
Subscribe to Our Newsletter
More Technology & AI
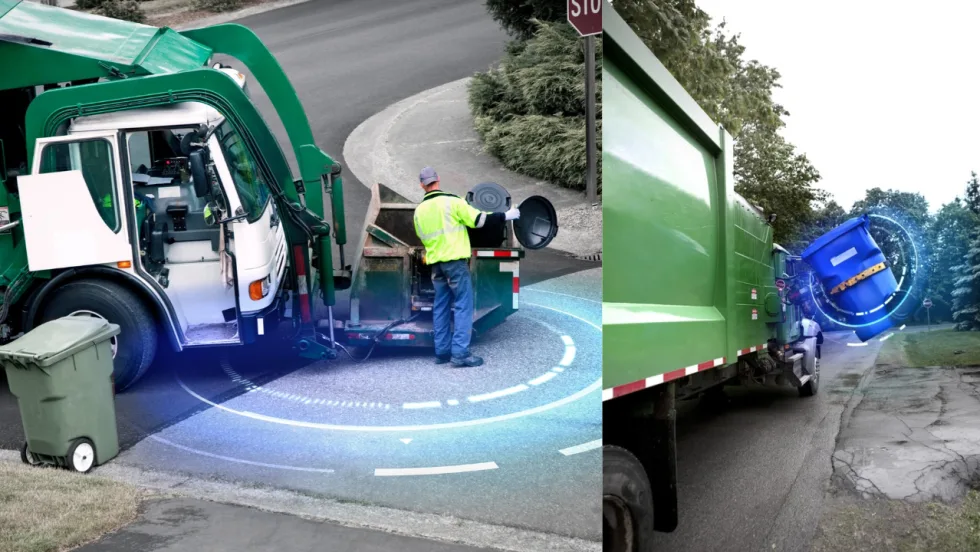
Lytx, WasteVision AI Integration Helps Waste Fleets Identify Missed Revenue
New integration uses existing fleet cameras to detect overflowing containers, recycling contamination, and service activity, helping waste fleets improve billing accuracy.
Read More →
Fleet Downtime, Truck Theft, and Electric Growth Lead This Month
Where is your fleet losing time? This Truck Chat recap connects repair delays, theft risks, storm planning, and lessons from scaling electric trucks.
Read More →
HCSS Partners with Verizon Connect to Deliver Fleet Intelligence for Construction Fleets
HCSS has integrated with Verizon Connect to provide near real-time fleet insights so contractors can spend less time tracking assets and more time keeping projects on schedule.
Read More →From Our Partners
Basic Tracking vs Next Generation Fleet Technology
Sponsored by AT&T Business

5 Facts Every Fleet Manager Should Know About Embedded Telematics
Sponsored by Stellantis/Mobilisights

How AI Video Telematics Boosts Driver Safety and Helps to Avoid Unnecessary Costs
Sponsored by Verizon Connect

Charting the 8 Bottom-Line Benefits of Workforce Optimization
Sponsored by Verizon Connect


How Fleets Can Use Technology to Fight Fuel Fraud
Fuel fraud and theft remain significant challenges for commercial fleets, whether the problem involves third-party fraud or driver misuse. In this video, David Abraham of WEX explains how SecureFuel uses vehicle geolocation, telematics, transaction information, and AI to help fleet managers identify suspicious fuel purchases and make more informed decisions.
Read More →
Can AI Agents Help Small Work Truck Fleets Do More With Less?
Motive's new AI Agents automate fleet safety, maintenance, compliance, and dispatch tasks. Here's how they work for smaller fleets, what managers control, and what early users are seeing.
Read More →
Paccar Launches Paccar Connect for Peterbilt and Kenworth Trucks
The new Paccar Connect offers touchscreen displays, telematics capabilities, and an expanding app ecosystem to boost productivity and streamline driver workflows.
Read More →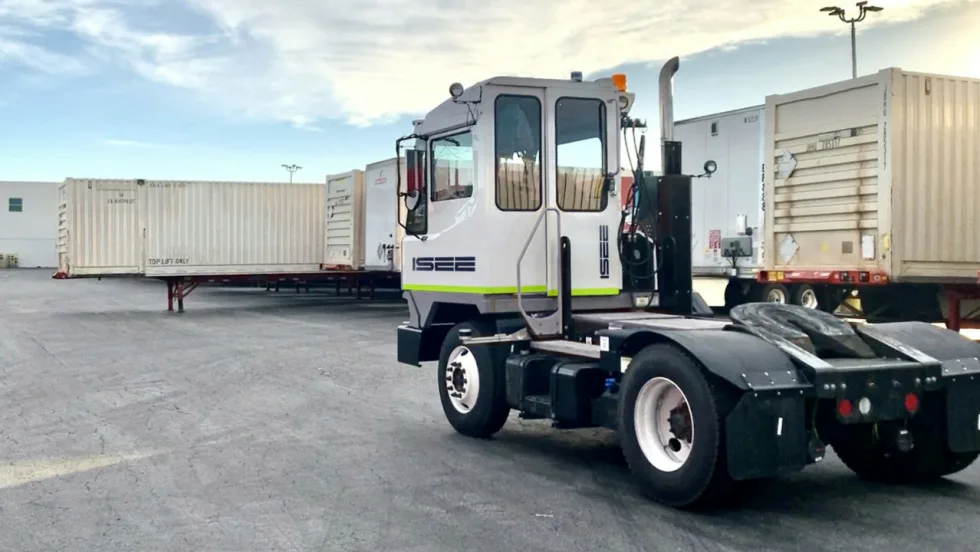
Holman and ISEE Partner to Expand Autonomous Yard Truck Operations
The partnership combines Holman's fleet management and upfitting capabilities with ISEE's autonomous driving technology to help businesses deploy and manage driverless yard trucks.
Read More →
Who You Gonna Call? Rivian Turns Electric Vehicles Into Ghostbusters Rides
Rivian teams up with Sony Pictures for a Ghostbusters-inspired Halloween software update, complete with custom sounds, lighting effects, and a special Ecto-R1.
Read More →
The Second Trip and What Missing Tools Really Cost a Service Business
For service fleets, missing tools and equipment can lead to second trips, lost technician time, higher operating costs, and delayed jobs. Equipment tracking can help HVAC, plumbing, electrical, landscaping, and other service businesses improve visibility and reduce downtime.
Read More →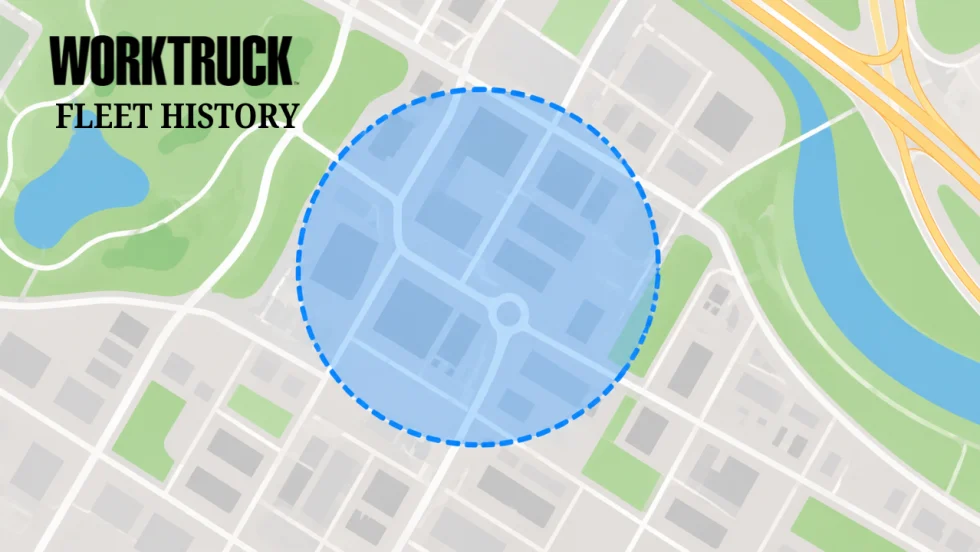
GeoFencing Adds to Your Truck Security Arsenal
Geofencing is a familiar fleet tool today, but its early adoption marked a major shift in vehicle tracking, route monitoring, and the debate over employee privacy.
Read More →