




Related: Vehicle Valuation 101
2015 Resale Forecast For Cars, Vans and Trucks
The depreciation rate for cars is expected to outpace trucks and vans, which will be aided by strong demand from small fleet buyers.
by RIcky Beggs, Black Book USA
January 29, 2015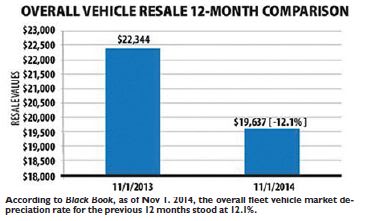
According to Black Book, as of Nov. 1, 2014, the overall fleet vehicle market depreciation rate for the previous 12 months stood at 12.1%.
6 min to read
As of Nov. 1, 2014, the overall fleet vehicle market depreciation rate for the previous 12 months stood at 12.1%. As a reference point, pre-Recession annual depreciation was generally in the 15% to 16% level. This current level of depreciation is a sign of a solid used vehicle market, supporting economic improvement.
When comparing levels of depreciation by car, truck and van configurations, there is a variance. As of Nov. 1, the depreciation rate for cars was 14.8%, while the depreciation rate for the mix of trucks, vans and utilities was an extremely low 10%.
Let’s take a closer look at the trends within the car, van and truck segments:
CAR DEPRECIATION TRENDS
Over the past year, even with low overall depreciation, the six segments with the largest depreciation rates were car-related. However, the two largest were ones with a small presence in commercial fleets — the prestige luxury car and luxury-level car segments.
The mid-size car segment, which has the highest volume of car models within the fleet industry, includes vehicles such as the Ford Fusion, Chevrolet Malibu and Nissan Altima. The combined entry and upper mid-size cars segment had a 14.9% annual depreciation in the past 12 months. This is greater than the overall industry average of 12.1%, but much better than the luxury-focused models of the prestige luxury car segment at 19.6% and the luxury-level car segment at 16.2%.
The next highest volume of cars in the overall fleet market consists of the full-size car segment, which includes vehicles such as the Chevrolet Impala, Ford Taurus and Dodge Charger.
The full-size car segment was among the six car segments with the largest depreciation rates. In fact, two had lower annual depreciation — the premium sporty car segment and the entry sporty car segment, at 12.3% and 13.3% respectively. The full-size car segment depreciated at 13.7% during the past year, and it continues to be of high interest once the vehicles are retired from their fleet usage.
The compact car segment, which includes the Ford Focus and Chevrolet Cruze, has very distinguishable seasonal variances. Annual depreciation in this segment was 15.6%.
VAN DEPRECIATION TRENDS
Like the full-size pickup market, the van market is a vital piece of the recovering economy. Service industries rely on vans, especially full-sized cargo versions, as their offices on wheels.
As we gather and track market data and talk with the buyers and sellers of these units, the reason for this segment’s strength becomes clear. These used van units have been extremely popular for many years within the service industries for specialists such as plumbers, electricians and carpet installers. With a steadily improving economy, the service industries are prospering while needing newer or additional units.
The second reason for the minimal depreciation is the high demand for vans in the used market, as many of the old-style units are no longer being manufactured. At some point, used buyers will accept the European-styled vans. For now, you can only wish you had more of these units coming out of fleet to run across the auction lanes.
Over the past three years, the full-size van segment has had an annual depreciation of 10% in 2011 — increasing to 11.3% and 11.4% in 2012 and 2013 respectively. Their interest exploded in 2014 as depreciation fell to 5%. We feel the demand will continue with depreciation climbing back to the 9.5% to 10% level in 2015.
TRUCK DEPRECIATION TRENDS
Throughout 2014, the auto industry has been recognized as the driver of much of the economic recovery.
Whether the industry has been the main driver or merely a major supporter of the economy’s improvement, there is no question that the low level of depreciation in light-duty pickup trucks’ value is a result of the demand for these working tools.
Black Book’s findings reveal that pickup trucks within the fleet industry will stay in service longer and will have significantly more miles on the odometer than volume sedans. According to a recent Black Book “Commercial Value Report,” the highest volume sedan for the 2012 model-year had an average mileage per unit of 49,000 at an average price of $10,400.
The mileage of the highest volume pickup, also a 2012 model, averaged 97,000 miles at the time of resale with an average price of $19,130. This is a prime example of the importance of the light-duty pickup market in the currently growing economy.
While the overall market depreciated by 12.1% over the past 12 months, the total truck market depreciated by 10% and the full-size pickup segment depreciated by an unbelievable 4.9%.
Why the minimal annual depreciation? The economy continues to improve, with the construction and service industries contributing to the growth. The current demand is barely being met with limited supplies.
All of this demand is not just within managed fleets; it’s also with the small companies that are prospering. In addition to their interest in full-size vans, local plumbers, electricians and even carpet installers have been looking for replacement used pickup trucks.
In addition, while there are greater volumes of several popular brands of pickups than the highest volume sedan models within new-car sales, there are fewer unit choices within several truck segments compared to many of the car-related segments in the commercial fleet remarketing field. This further affects supply and demand while also contributing to the lower average truck depreciation.
DEPRECIATION INCREASING IN 2015
What do these statistics mean for 2015? To answer this question, the primary fleet market needs to be looked at from the perspective of the compact, mid-size and full-size car segments.
The highest volume is the mid-size segment, and with all of the redesigns and refreshes since 2011, this area has done well in retention. Higher fuel prices until 2013 and 2014 had also supported this segment.
As these models age and supplies increase, the depreciation will increase slightly to an annual level of 15.5% for mid-size cars in 2015. The full-size car segment should be slightly higher at 15.7%.
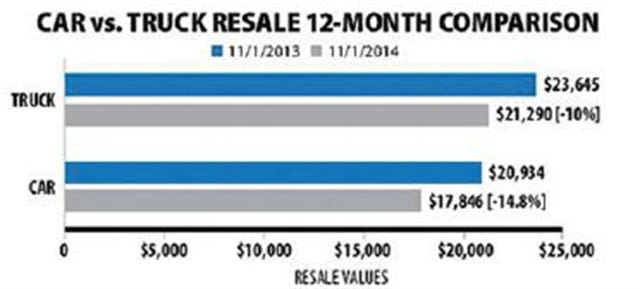
According to Black Book, over the past 12 months to Nov. 1, 2014, the depreciation rate for cars was 14.8%, while the depreciation for the mix of trucks, vans and utilities was 10%.
The real question mark is compact cars. Falling gasoline prices and a lower national average expected for 2015 will put additional pressure on more fuel-efficient models. Compact cars will have some seasonality peaks, but overall are expected to depreciate by about 15.8% for the year.
In the pickup segments, it is unrealistic to expect this low level of depreciation to continue into 2015. Over the past two years, all full-size pickups from Detroit have been refreshed or completely overhauled — some with new structural materials.
Vehicles in this segment have shifted from the highest-horsepower V-8 engines to supercharged six-cylinder engines and even diesels in 1/2-ton applications. These vehicles also include technology-laden direct injection and cylinder deactivation, all while gasoline prices at the pump plummet.
Although demand for light-duty pickups will continue and the used market will be ready for new technology, this comes at a time when new pricing will be bumping against the acceptance ceiling. As a result, depreciation of trucks should be greater than 2014 levels. Still, this market should be trending better than the car market.
In the van segments, after falling off in late 2013 and early 2014, sales of full-size passenger and cargo vans rebounded by the end of 2014. Almost every month after the first quarter of 2014 there have been sales increases for traditional U.S.-style vans: sometimes as cargo versions, but mostly as passenger versions. Black Book has found the market has rebounded as a function of the recovering economy. Service organizations need more vans to fulfill their business functions.
Subscribe to Our Newsletter
More Remarketing & Lifecycle

Ford Pro Launches Certified Pre-Owned Program for Class 1-7 Work Trucks
Ford Pro Advantage brings manufacturer-backed inspections, warranties, roadside assistance, and service support to used Class 1-7 commercial trucks and vans.
Read More →
The Hidden Cost of Idling
A low-mileage truck can still be one of the fleet’s hardest-working and most worn assets. Engine hours, idle time, and duty cycle reveal what the odometer misses.
Read More →
Building a Better Vehicle Replacement Model
Meter readings still matter, but engine hours, idle time, maintenance trends, and utilization can help fleets spot costly vehicles before the odometer does.
Read More →

AP Fleet Management Expands Remarketing Program for Commercial Work Trucks
AP Fleet Management expanded its commercial vehicle remarketing program with dedicated resale services and an online marketplace for used work trucks.
Read More →
What Actually Makes a Truck Reliable for Fleets?
What makes a truck reliable for fleets? From uptime to maintenance and spec’ing, here’s what really drives performance, and where fleets can weigh in.
Read More →
REP Inspection Services Launches, Delivering Professional Equipment Inspections
REP Inspection Services, led by someone with more than 30 years of industry experience, has launched its professional inspection services for trucks, trailers, and equipment across the commercial vehicle industry.
Read More →
Introducing Work Truck’s 2025 Remarketing Report Series
Work Truck’s 2025 Remarketing Report Series uncovers how data, timing, and technology are reshaping resale value and driving smarter fleet strategies.
Read More →
Fleet Remarketing Outlook 2026: EVs, Policy, and the Power of People [Part 4]
From EVs to policy changes, the 2026 fleet remarketing outlook is all about people, progress, and finding opportunity in stability.
Read More →
Digital Fleet Remarketing: How Tech and Transparency Build Buyer Confidence [Part 3]
Technology and trust are reshaping fleet remarketing in 2025. See how data, transparency, and partnerships drive better resale outcomes.
Read More →
Fleet Replacement Strategy 2025: When to Hold and When to Fold [Part 2]
Knowing when to sell or hold is key in 2025. Discover how fleet professionals use data and TCO insights to make smarter remarketing calls.
Read More →