




TomTom Traffic Index 2024 Shows U.S. Cities with Increased Congestion and Slower Speeds
New York drivers lost 94 hours to congestion in 2024! Explore the latest traffic trends and how fleet managers can combat rising delays.

Urban congestion is on the rise! TomTom’s 2024 Traffic Index reveals how U.S. cities rank in travel delays and what it means for fleet operations.
Photo: Work Truck | Tom Tom
TomTom's 14th annual Traffic Index has revealed notable trends in urban mobility across the globe, with U.S. cities experiencing a 9% increase in traffic congestion compared to 2023. Analyzing traffic data from 500 cities in 62 countries, this year’s report is TomTom’s most extensive yet, providing fleet managers with actionable insights to navigate today’s transportation challenges.
In the U.S., urban centers like New York, Los Angeles, and Miami topped the rankings for congestion and travel delays. With freight traffic rising alongside e-commerce demand, the report highlights critical areas for optimization in fleet logistics and route planning.
Rising Congestion Across the U.S.
The 2024 report shows an increase in congestion levels across major U.S. cities, complicating mobility for fleets and commuters alike. Notable findings include:
New York City remains the slowest city for travel, with a 6-mile trip averaging 30 minutes at just 12 mph.
Providence, Rhode Island, saw the largest congestion increase, jumping 50% compared to 2023.
Los Angeles had the highest congestion level at 43%, with some areas like Santa Monica exceeding 52%.
Top 10 U.S. Cities with the Slowest Average Speeds (2024)
Rank | City | State | Average Travel Time (6 miles) | Avg Speed (2024) | Avg Speed (2023) | Change (%) |
|---|---|---|---|---|---|---|
1 | New York | NY | 30:01 | 12.0 mph | 12.2 mph | +2.3 |
2 | San Francisco | CA | 25:37 | 14.0 mph | 14.4 mph | +1.9 |
3 | Honolulu | HI | 19:56 | 18.0 mph | 18.2 mph | +0.6 |
4 | Chicago | IL | 19:10 | 18.8 mph | 19.3 mph | +3.0 |
5 | Philadelphia | PA | 18:54 | 19.0 mph | 19.7 mph | +3.4 |
6 | New Haven | CT | 18:38 | 19.3 mph | 19.7 mph | +2.1 |
7 | Columbia | SC | 18:25 | 19.5 mph | 19.7 mph | +0.9 |
8 | Washington | DC | 17:56 | 20.1 mph | 20.6 mph | +2.8 |
9 | New Orleans | LA | 17:37 | 20.4 mph | 21.1 mph | +3.4 |
10 | Miami | FL | 17:03 | 21.1 mph | 21.8 mph | +3.2 |
Traffic Impacts on Fleet Management
For fleet managers, the increase in congestion means higher costs, longer delivery times, and more fuel consumption. Key insights for fleet operations include:
Time Lost in Traffic: In New York City, fleet drivers lost an average of 94 hours to peak-hour congestion in 2024, a 5.5% increase from 2023.
Cost Implications: Increased travel times and delays elevate operational expenses, particularly for last-mile deliveries.
Dynamic Routing Solutions: Leveraging traffic data can help mitigate delays by enabling dynamic rerouting and smarter scheduling.
Top 10 U.S. Cities with the Highest Congestion Levels (2024)
Rank | City | State | Avg Congestion Level (2024) | Change from 2023 |
|---|---|---|---|---|
1 | Los Angeles | CA | 43% | +4.3% |
2 | Honolulu | HI | 34% | +3.7% |
3 | Miami | FL | 33% | +11.0% |
4 | Fort Myers | FL | 32% | +7.0% |
5 | San Francisco | CA | 32% | +6.0% |
6 | Tampa | FL | 32% | +13.1% |
7 | Chicago | IL | 31% | +9.9% |
8 | Seattle | WA | 31% | +11.4% |
9 | Providence | RI | 31% | +48.8% |
10 | Atlanta | GA | 31% | +9.2% |
A Call to Action for Smarter Fleet Solutions
TomTom’s findings emphasize the need for data-driven decision-making in urban mobility. Fleet managers can utilize tools like real-time traffic monitoring and advanced navigation systems to adapt to dynamic traffic conditions. Additionally, proactive investments in driver training, fuel-efficient vehicles, and logistics optimization can help mitigate the financial and operational impacts of growing congestion.
The full 2024 TomTom Traffic Index is available for further insights, offering fleets an invaluable resource to improve route efficiency and operational planning.
More Safety & Compliance
Fleetworthy Expands Expedited Inspection to 5 States
Following its industry-first launch in Nevada, Fleetworthy’s automated inspection technology is now live in California, Michigan, Vermont, and Maine.
Read More →
Crossing State Lines in a Light-Duty Work Truck? Check These Rules First
Crossing state lines in a lighter work truck? J.J. Keller's Kathy Close explains when IRP registration, trip permits, and towing rules come into play.
Read More →
GeoFencing Adds to Your Truck Security Arsenal
Geofencing is a familiar fleet tool today, but its early adoption marked a major shift in vehicle tracking, route monitoring, and the debate over employee privacy.
Read More →From Our Partners



Recalls You Need to Know About in October 2026
In October 2026, what recalls might impact your fleet? Work Truck has the answers in this comprehensive overview of recent NHTSA recalls.
Read More →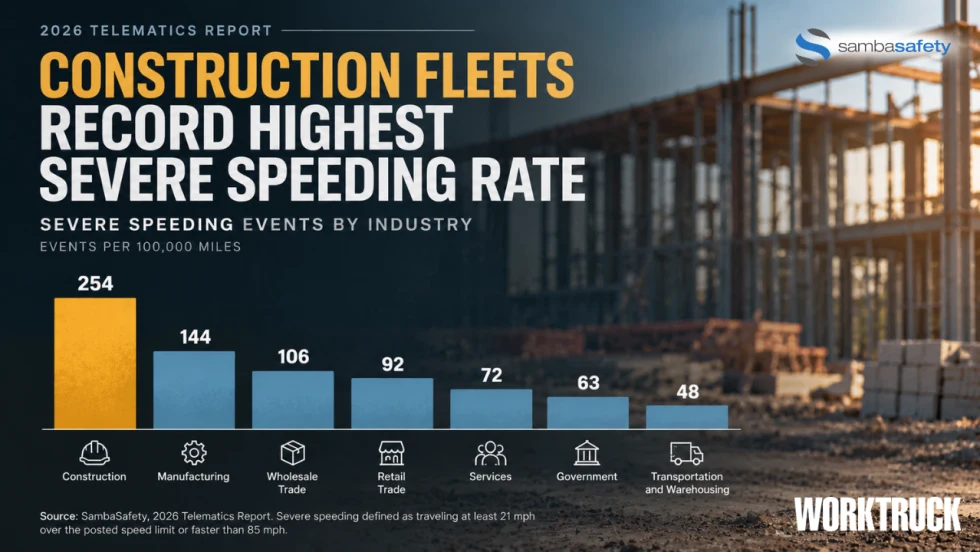
Construction Fleets Show Telematics Adoption Alone May Not Reduce Driving Risk
SambaSafety found construction fleets monitor roughly 92% of their vehicles but recorded the highest severe speeding rate among industries studied.
Read More →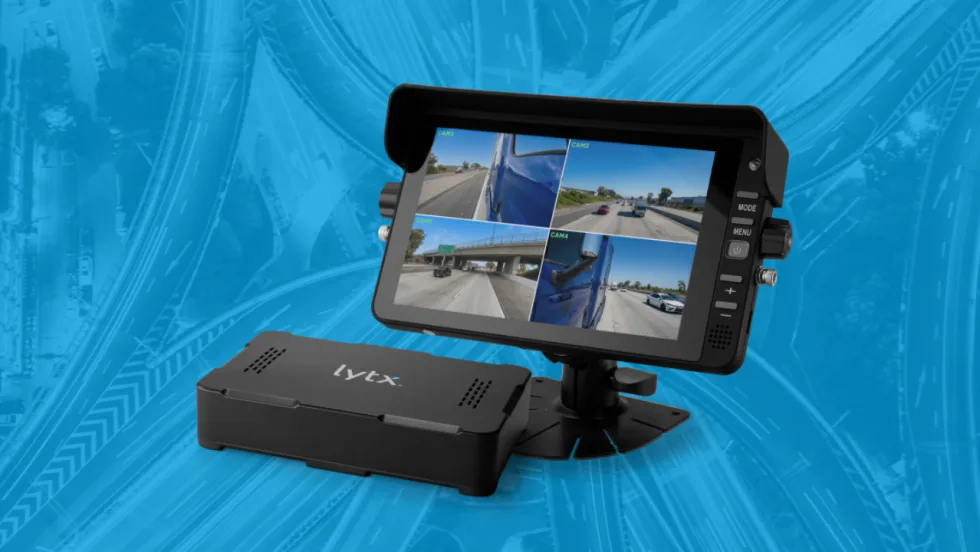
Lytx Launches 360 Hub Kit for Expanded Fleet Camera Visibility
Lytx’s new AI-ready gateway and HD auxiliary camera ecosystem, the Lytx 360 Hub Kit, extends visibility across side, rear, cargo, and blind-zone views to help fleets see more and respond faster.
Read More →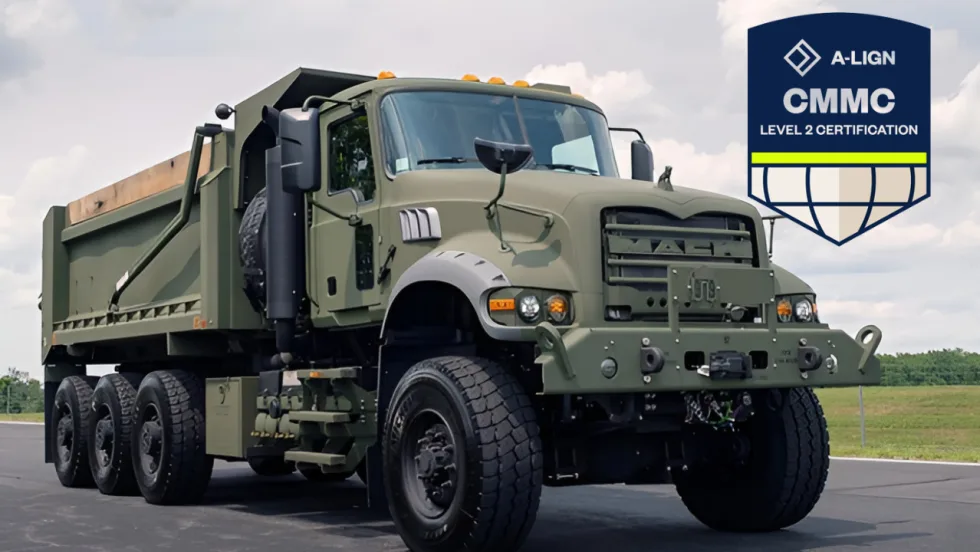
Mack Defense Achieves Cybersecurity Maturity Model Certification Level 2
After an assessment conducted by an authorized Certified Third-Party Assessment Organization (C3PAO), Mack Defense has achieved Cybersecurity Maturity Model Certification (CMMC) Level 2.
Read More →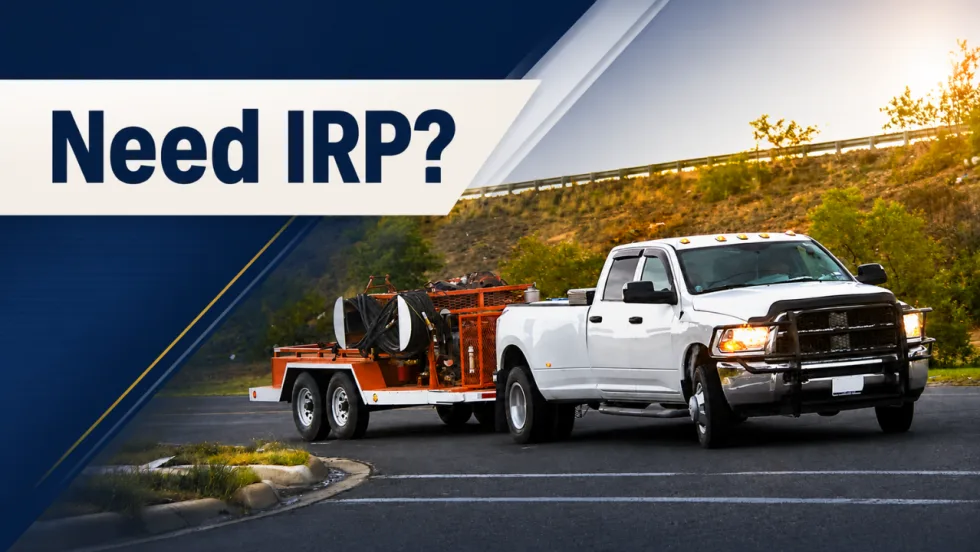
When Work Trucks Under 26,001 Pounds Need IRP Registration
Think trucks under 26,001 pounds are automatically in the clear when it comes to IRP? Not always. Learn where lighter vehicles can still run into trip permit, apportioned registration, and IFTA compliance requirements when crossing state or provincial lines.
Read More →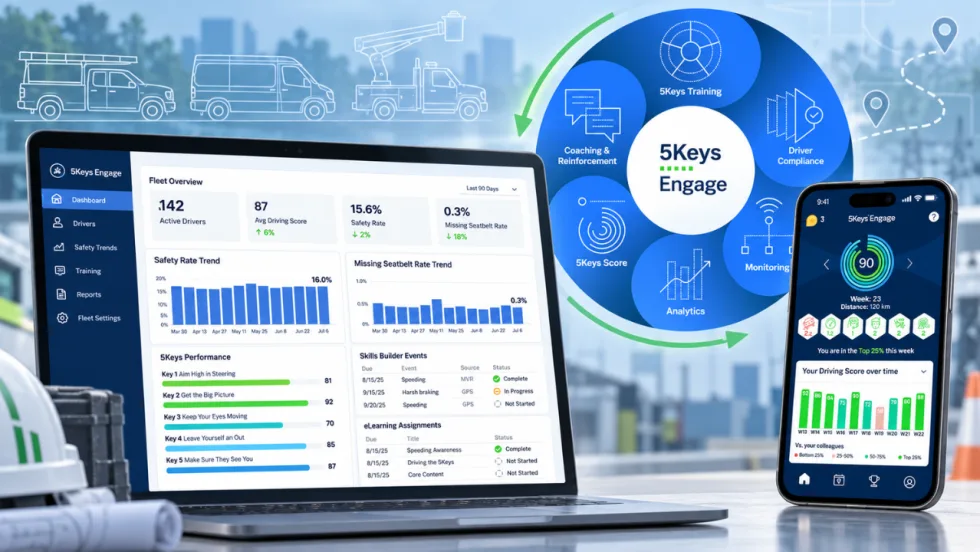
Smith System Wants Work Truck Fleets to Look Beyond the Driver Alert
Smith System’s new Driver Risk Management program is built to help mixed work truck fleets turn telematics alerts and observations into specific behaviors, coaching actions, and measurable follow-up.
Read More →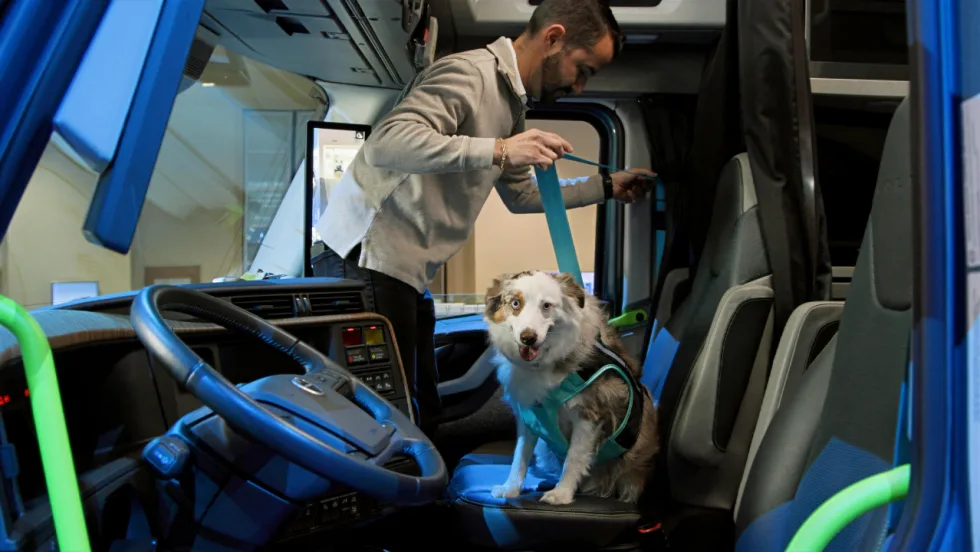
Volvo Trucks Releases New Safety Recommendations for Traveling with Pets
One of the most important recommendations for professional drivers traveling with pets is to ensure pets are properly restrained while the truck is moving. Other tips are available in the new guide from Volvo Trucks North America and Center for Pet Safety.
Read More →