




Geotab Data Shows Regional Trucking Growing Faster as Last Mile Routes Get Denser
Geotab's first U.S. supply chain report finds stable long-haul activity, stronger regional freight movement, tighter hub-and-spoke utilization, and more last-mile trips on shorter routes.

Geotab’s Health of the U.S. Supply Chain report tracks long-haul, regional, hub-and-spoke, last-mile, and drayage activity to show how freight movement shifted from Q4 2025 through Q2 2026.
Work Truck
- Geotab's report indicates a stable level of long-haul trucking activity in the U.S. supply chain.
- Regional freight movement is experiencing growth, with tighter hub-and-spoke utilization observed.
- There is an increase in last-mile delivery trips, which are occurring more frequently on shorter routes.
*Summarized by AI
The U.S. freight network may not be growing evenly, but new commercial vehicle data from Geotab shows it is changing shape.
Geotab’s new Health of the U.S. Supply Chain report found long-haul trucking remained relatively steady from Q4 2025 through Q2 2026, while regional trucking recorded the strongest growth among the freight movement categories studied. At the same time, hub-and-spoke fleets increased utilization and last-mile operators made more trips while reducing the average distance traveled per trip.
For work truck fleets, the findings provide a closer look at how freight movement is shifting closer to customers and how fleets are getting more work from existing vehicles rather than simply adding capacity.
Regional Trucking Posts the Strongest Growth
Regional trucking stood out in the report. From the Q4 2025 baseline through Q2 2026, regional trip volume increased 3.8%, while vehicle miles traveled increased more than 5%. Geotab found regional trip volume and mileage grew more than any other classification during the study period.
Median regional trip mileage also moved from 100.3 miles in Q4 to 101.9 miles in Q1 and 102 miles in Q2. Utilization remained relatively steady, ranging from 74.4% to 74.7%.
Geotab’s analysis suggests existing regional trucks handled the additional demand through more trips, longer drive times, and extended workdays rather than through a significant increase in fleet capacity.
The company said regional activity outpacing long-haul could indicate more goods are being positioned closer to end markets, although some freight shifting to rail could also be contributing.
That contrasts with long-haul activity, which remained largely flat. Long-haul journey volume and VMT posted only modest changes across the three-quarter study period.
Hub-and-Spoke Fleets Get More From Existing Trucks
The report also points to increasing utilization across hub-and-spoke networks. Trip volume and VMT remained below the Q4 2025 baseline following the normal post-holiday decline, but utilization increased from 80.3% in Q4 to 83.3% in Q1 and 84.3% in Q2.
Geotab characterized the trend as operators getting more from the equipment already in service. From Q1 to Q2, hub-and-spoke fleets increased trip volume, mileage, and utilization without a comparable expansion in capacity.
The report noted that further demand would likely require additional capacity if operators cannot continue absorbing growth through higher utilization.
Last-Mile Fleets Make More Trips on Shorter Routes
The city data tells a different part of the freight story.
Geotab found door-to-door delivery trip volumes increased from the Q4 baseline in all four cities studied, while average miles per trip declined from Q1 to Q2. The pattern means fleets were making more local delivery trips while traveling shorter distances per trip.
During a media briefing on the report, Work Truck asked whether the shorter last-mile trips could be connected to the growth in regional mileage, particularly as distribution networks move closer to urban markets.
Mike Branch, VP of Data and Analytics at Geotab, said a connection is possible, but the company is also seeing signs of fleets improving routing and delivery optimization in markets such as Los Angeles and New York.
The city-level numbers show how differently that optimization can play out. Atlanta showed the steadiest growth across all metrics, with last-mile trip volume jumping 24.5% in Q2. Its utilization rate also increased from 69.1% in Q4 to 72.8% in Q2.
Los Angeles recorded the largest overall increase in delivery trips, with trip volume reaching nearly 40% above the Q4 baseline by Q2. Geotab’s analysis of the Los Angeles market covered more than 7.5 million quarterly door-to-door trips and almost 15,000 unique vehicles per quarter.
Denver stood out for consistently shorter routes. Average miles per delivery trip declined 6.7% in Q1 and another 19.7% in Q2 while trip volume continued climbing.
In New York, approximately half of tracked commercial vehicles were classified as door-to-door, while last-mile vehicles accounted for nearly two-thirds of commercial driving miles.
Taken together, Geotab said the pattern points toward denser last-mile operations, with fleets completing more deliveries on shorter routes. The company said that can improve productivity by allowing more deliveries without a proportional increase in operating costs.
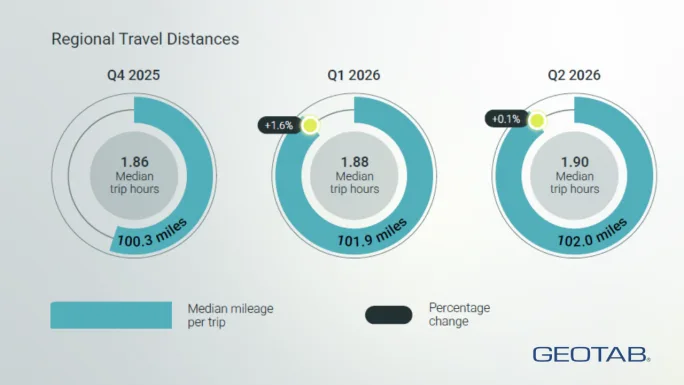
Regional trucking logged slightly longer trips across the study period, with median mileage rising from 100.3 miles in Q4 2025 to 102 miles in Q2 2026. Geotab said regional activity grew faster than the other freight classifications it studied
Geotab
Port Volume Does Not Always Mean More Truck Trips
Another finding challenges the assumption that growing container traffic will automatically translate into more drayage truck activity.
At the Los Angeles and Long Beach ports, Geotab recorded essentially flat drayage activity across the study period even as the ports reported their strongest month of 2026, with container activity about 12% higher than a year earlier. Geotab said the difference suggests rail may have absorbed some of that additional freight.
The report noted that New York and New Jersey showed a closer relationship between port container activity and truck movements. Geotab said the findings suggest port throughput may not always serve as a direct proxy for drayage demand.
Tracking Commercial Traffic at Scale
The report was developed by Altitude by Geotab using anonymized telematics data from Geotab’s connected vehicle network.
Geotab connects approximately 6 million vehicles and assets and processes about 100 billion data points daily. The report estimates its data represents roughly 12% of U.S. commercial vehicle travel.
Across the three-quarter study period, Geotab analyzed:
- More than 1.2 million long-haul journeys per quarter
- Approximately 1 million regional trips per quarter
- About 230,000 hub-and-spoke trips per quarter
- More than 50 million door-to-door delivery trips per quarter across four cities
- Approximately 254,000 port entries per quarter across the Los Angeles/Long Beach and New York/New Jersey port complexes
Those movements were analyzed across four major interstate corridors, I-10, I-35, I-80/90, and I-95, along with commercial vehicle activity in Atlanta, Denver, Los Angeles, and New York.
Vehicles were classified using observed driving patterns into long-haul, regional, hub-and-spoke, and door-to-door operations. Drayage was measured separately using truck entries into port zones.
Activity was normalized per vehicle per active workday rather than using raw totals. According to Geotab, that approach is designed to measure how individual vehicles are being used rather than allowing changes in the number of vehicles enrolled on its platform to influence the results.
During the briefing, Branch also said published reports surface selected metrics and indices, while more detailed underlying data remains available to customers through the Altitude platform. The platform is also used by organizations including municipalities and departments of transportation.
What the Data Shows About the Changing Freight Network
The report’s broader takeaway is that different parts of the freight network are moving at different rates rather than showing a simple nationwide increase or decline in activity.
Long-haul remained stable. Regional trucks handled more trips and miles. Hub-and-spoke fleets pushed utilization above 84%. Last-mile fleets increased delivery density, while higher container activity at the ports did not necessarily translate into more truck movements.
“By analyzing approximately 12% of all U.S. commercial traffic, our report offers a unique view of freight movement across key U.S. cities and corridors,” Branch said.
For work truck fleets, the findings put another spotlight on utilization, routing, delivery density, and where freight is moving within the broader supply chain. As more activity shifts toward regional and last-mile operations, understanding how existing vehicles are being used may be just as important as tracking how many trucks are on the road.
Quick Answers
Geotab's report found stable long-haul activity, increased regional freight movement, optimized hub-and-spoke utilization, and more frequent last-mile trips on shorter routes.
*Summarized by AI
More Technology & AI

When Fleet Technology Helps and When It Just Adds Complexity
New technology can help fleets work smarter, but only if it solves the right problem. Lauren Fletcher talks with AP Fleet’s Alex Coveney about innovation, AI, data, and knowing when a new solution is actually worth adopting.
Read More →
Volvo Trucks’ 'Lock and Leave' Software Updates Go Live Across North America
Unattended over-the-air software updates are now available in Volvo trucks across the U.S. and Canada. The new capability lets trucks stay current with the latest software without interrupting operations or requiring a dealership visit.
Read More →
GM Brings New Truck Focused Interface to 2027 Silverado and Sierra
GM's new pickup interface puts trailering data, camera views, vehicle controls, and smartphone integration closer to the driver in the 2027 Silverado and Sierra.
Read More →From Our Partners




Samsara Driver Perks Expands Rewards Beyond the Long Haul Driver
Samsara’s new driver rewards program was built with a broader professional driver in mind, including employees who split their day between driving, job sites, service calls, and other work.
Read More →
AI Service Advisor Aims to Cut Fleet Repair Downtime
Fleetio said its AI Service Advisor can help fleets cut repair downtime by an average of 2.5 hours per repair while reducing manual maintenance work.
Read More →
Verra Mobility Launches AI-Driven Title & Registration Solution
Verra Mobility has launched a new AI-driven Title & Registration platform to help fleets move vehicles from acquisition to the road the same day while reducing compliance risk.
Read More →
Wialon Unlocks OEM Data to Give Fleet Owners Data Ownership & Operational Clarity
Wialon has introduced hardware-free OEM integration as the EU Data Act accelerates the shift in vehicle data access across the fleet industry in many countries.
Read More →
Teletrac Navman Promotes New CEO from Within
Teletrac Navman’s next CEO, Ricardo Buranello, has served as the company’s chief financial and operating officer. He brings deep financial and operational expertise, a strong strategic orientation, and an intimate knowledge of the business to his new role.
Read More →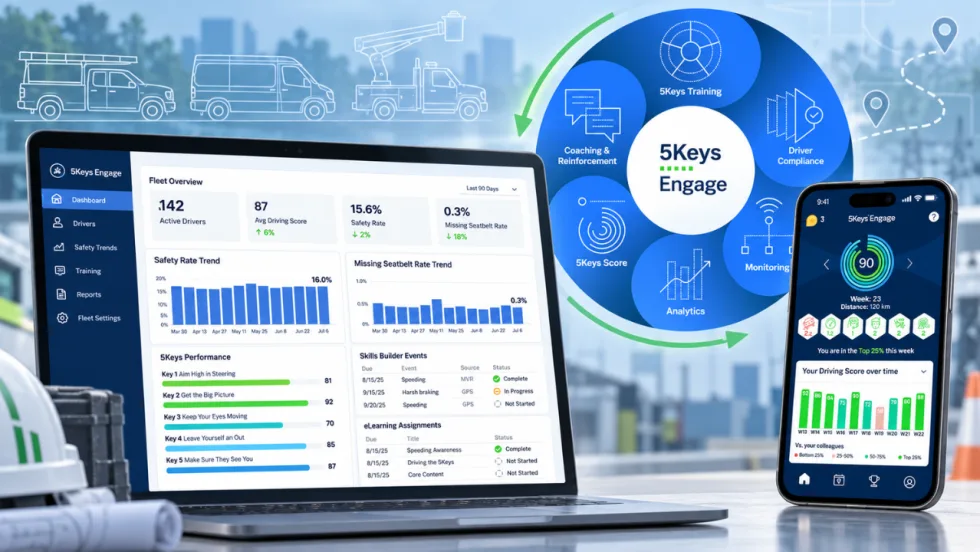
Smith System Wants Work Truck Fleets to Look Beyond the Driver Alert
Smith System’s new Driver Risk Management program is built to help mixed work truck fleets turn telematics alerts and observations into specific behaviors, coaching actions, and measurable follow-up.
Read More →
Ford Pro Software Updates: August 26
Check out the latest Ford Pro software updates, including Google Maps integration, Remote Vehicle Alarm integration, Motor Pool for easier management of shared pool vehicles, and more.
Read More →