





Beyond Efficiency: How Fleet Technology Is Saving Lives
Driving Report Reveals Decrease in Risky Driving in 2022
Lytx published the 2023 “State of the Data” report that reveals crucial safety trends for fleets.
May 23, 2023
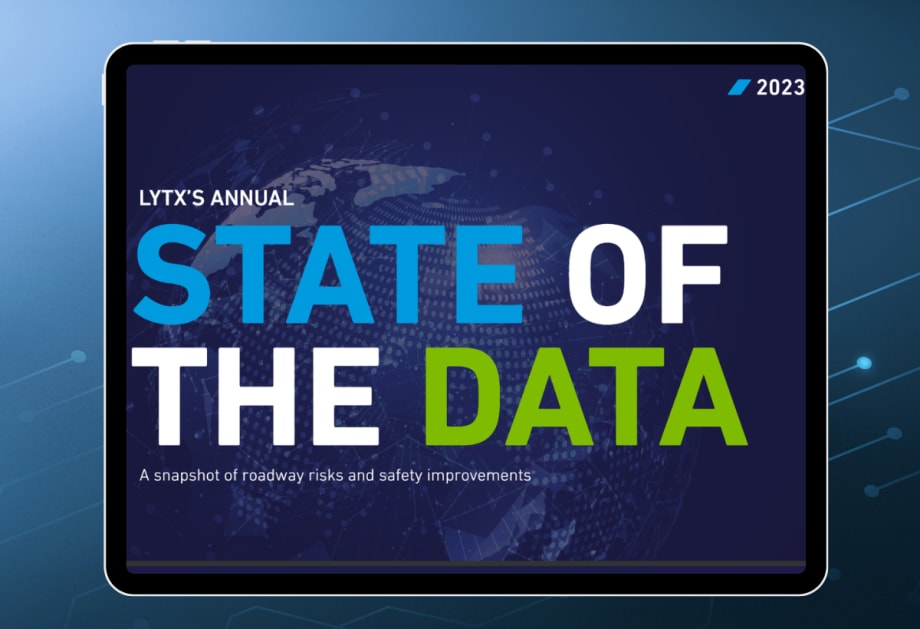
“State of the Data” report examines peak collision times and places among other trends.
Photo: Lytx/Work Truck
5 min to read
Lytx released its fifth annual “State of the Data” report for trucks and vehicle fleets.
The report revealed trends in risky driving and safety.
Leveraging the Lytx Driver Safety Program and over 36 billion miles of new driving data (over 221 billion miles total) captured through Lytx’s DriveCam Event Recorders, 2022 showed a decrease in overall risky driving even as miles driven increased.
Report findings also highlight the significant influence that time of day, day of the week, road conditions, and specific road segments played in risky driving behavior and collisions.
Diving Into Risky Driving
Data from 2019 to 2022 shows traffic has returned to pre-pandemic levels last year.
The National Highway Traffic Safety Administration (NHTSA) indicated that although fatalities displayed indications of stabilizing in 2022, they remained high following two consecutive years of notable escalation.
On a positive note, during the same period, motorists using Lytx technology and safety programs demonstrated sustained advancements in their driving habits, leading to a noteworthy reduction in both risky driving incidents and collisions per mile traveled in 2022, as compared to 2019.
Positive Trends in Driving Behavior
In 2022, overall risky driving improved by a significant 29% over 2019 (the last “normal year” before COVID-19-related disruptions).
The Lytx Risk Score for 2019 was 18.3, while in 2022 it improved to 12.9.
Collisions per 1,000,000 miles driven also dropped, resulting in a 23.1% decrease from 2019 to 2022.
Based on data analysis, drivers demonstrated significantly improved safety practices and attentiveness on the roads as traffic returned to pre-pandemic levels, leading to decreased collisions per mile driven.
Lytx, using its risk-scoring system, contributed to these findings by capturing over 14 million instances of risky driving within vehicle fleets in 2022.
This proprietary system evaluates road conditions and driving behaviors across various industries, leveraging driving data from Lytx's extensive global database.
Coaching Drivers to Lower Risk
Drivers significantly improved certain risky driving behaviors when comparing 2022 to recent years.
This progress can be attributed to more fleets employing coaching tools and workflows that allow fleet managers and drivers to work together to identify areas of improvement and reward risk reduction continually.
The following were the five most improved risky driving behaviors from 2021 to 2022:
Not scanning roadway: Down 18%.
Blank stare: Down 16%.
Driving too fast for conditions: Down 11%.
Driver unbelted on a residential road: Down 10%.
Veering off identifiable roadway: Down 9%.
While various driving habits improved over the last year, “driving too fast for conditions” was also the number one improved risky driving habit comparing 2022 to 2020, down 52%, and number two, down 74%, comparing 2022 to 2019.
Top 5 Riskiest Driving Cities
New York, NY.
Philadelphia, PA.
Los Angeles, CA.
Chicago, IL.
Dallas/Fort Worth, TX.
While many of 2021’s riskiest driving cities remained in the top five, Atlanta improved to number seven, while Dallas/Fort Worth entered the top five. New York remained number one for the second year in a row.
Top 5 Riskiest Public Roadways
Michigan (I-94 at Merriman Road, Romulus)
A complex airport interchange
New York (George Washington Bridge near Riverside Drive, NY)
The world’s busiest vehicular bridge
California (Edom Hill Road and Varner Road, Desert Hot Springs)
A lack of lane markings
New Jersey (NJ19 and I-80 in Paterson)
A complex interchange, with highways terminating into city streets
Connecticut (I-95 near Fulton Terrace, New Haven)
A curved freeway entering the busy port of New Haven
Airports Rising in Danger
Airports have emerged as some of the nation’s most dangerous driving areas.
14 out of 30 of the highest-risk sections of public and private roadways were within two miles of airports in 2022. This number was up 86% from 2021 when eight of the top 30 highest-risk roadways were near airports.
Top five high-risk airports to drive around:
Denver International
John Glenn Columbus International
Phoenix Sky Harbor
John F. Kennedy International
Newark Liberty International
Peak Traffic Hours as the Most Collision-Prone
The time of day impacts the likelihood of a collision:
In 2022, the most collisions occurred during the daytime (6 a.m.-4 p.m.), with the most occurring at 11 a.m.
Alternatively, the highest collisions per vehicle (those on the road at each hour) occurred in the middle of the night (2 a.m.-6 a.m.), with 2 a.m. the most likely time for a collision.
The data showed that the most significant number of collisions occurred when traffic volumes were highest during the day, and per-vehicle collisions occurred most often late at night when visibility was darkest and traffic volumes were lower.
Even the day of the week impacts the likelihood of a collision:
In 2022, the highest collisions per vehicle occurred on Tuesdays.
Saturdays were the safest day of the week, with the lowest collisions per vehicle. Sundays were the second lowest.
Findings suggest that high weekday commute traffic is closely correlated to higher collisions and was further supported by weekend lows.
Most collisions happen in clear weather, often due to animal strike:
While 13.1% of collisions occurred during rainy weather, 83.9% occurred in clear conditions, with only 2.9% occurring in snowy weather and 0.1% in foggy conditions.
Animal strikes accounted for 29.7% of the collisions in clear weather and 9.4% in rainy conditions. In contrast, fixed objects accounted for 11.7% of accidents in clear conditions and 16% in rainy conditions.
Economic and Environmental Impact on Fleets
Vehicles spent less time idling in 2022 compared to 2021.
In 2020 and 2021, there were dramatic disruptions to the supply chain. These headwinds led to fleets of trucks regularly waiting at ports and other shipment locations for hours or days rather than minutes.
However, idling-related losses and pollution dropped measurably as the supply chain recovered.
Want to reduce idling in your fleet? We've got you covered with "Tips for Identifying ‘Idle Offenders’ in Your Fleet."
More Safety
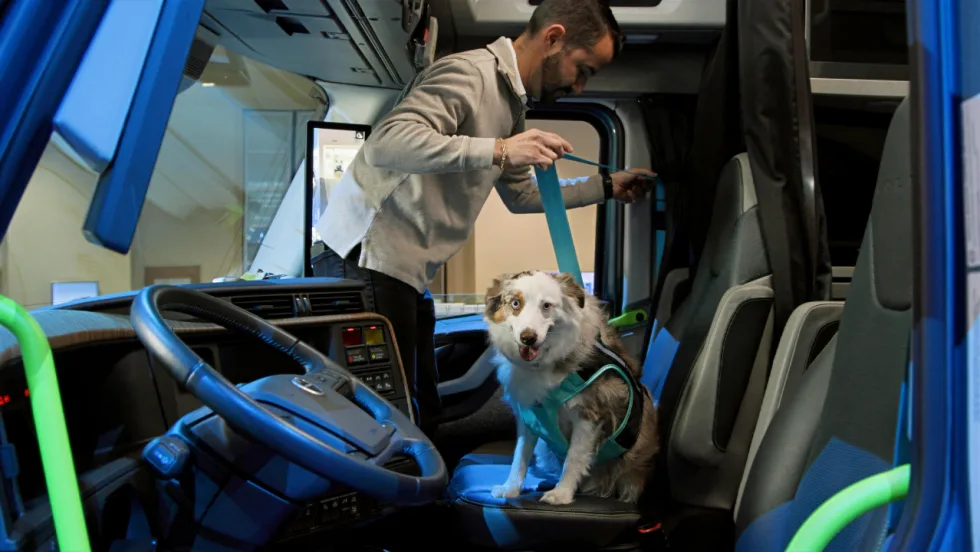
Volvo Trucks Releases New Safety Recommendations for Traveling with Pets
One of the most important recommendations for professional drivers traveling with pets is to ensure pets are properly restrained while the truck is moving. Other tips are available in the new guide from Volvo Trucks North America and Center for Pet Safety.
Read More →
API Issues Refueling Safety Guidelines
The American Petroleum Institute offers a list of safe vehicle refueling guidelines, including ways to avoid potential problems with static electricity discharges in fall, winter, and early spring.
Read More →
Winter Fleet Prep: Expert Tips to Keep Vehicles Running Smoothly
Cold weather can expose weak batteries, tires, fuel systems, and maintenance gaps fast. Use this winter fleet checklist to prepare trucks and drivers before temperatures drop.
Read More →
When a Work Truck Breaks Down, the Job Can Stop, Too
A work truck breakdown can stop more than the vehicle. Discover how payloads, jobsites, and specialty equipment change the roadside response.
Read More →
What Stronger Long-Term Fleet Service Partnerships Actually Require
Fleet service partnerships rarely fall apart all at once. Learn the three warning signs that trust is eroding and what fleets and providers can do before downtime, frustration, and lost revenue follow.
Read More →
Applause & TRUCE Software Partner to Improve Driver Safety Through AI-Powered Telematics & Employee Performance Management
Applause has integrated TRUCE driving metrics directly into its employee-first performance and safety platform that transforms mobile devices into AI-powered telematics.
Read More →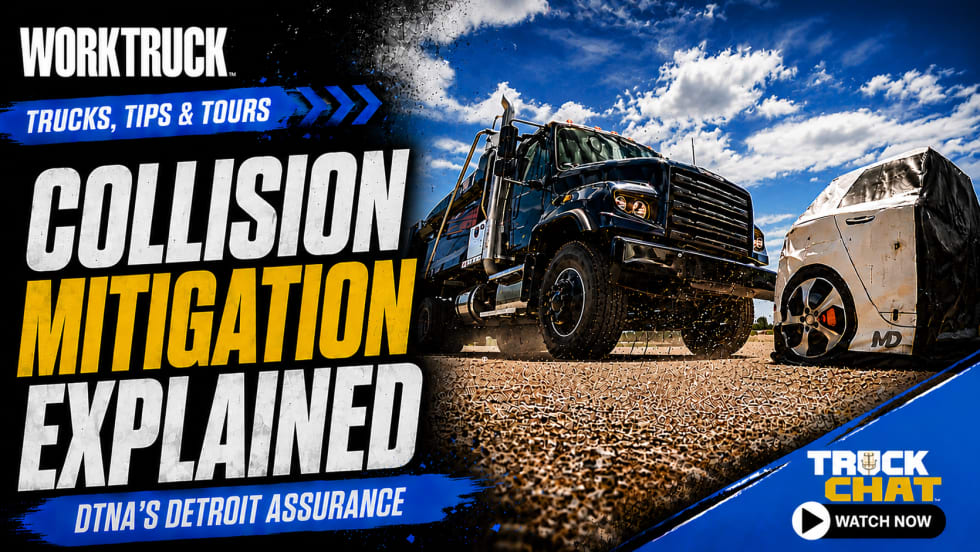
How Detroit Assurance with Active Brake Assist Works
Do you want to see what it is like to experience Detroit Assurance’s Active Brake Assist? In this video, Work Truck will put you in the cab to see how it all works and then hear more details from DTNA’s Mike Young.
Read More →
Get Left of Loss: A 5-Step Workplace Violence Prevention Framework for Fleet Operators
Violence risks do not stop at the driver’s door. Learn five practical steps fleets can take to spot threats early and protect workers before loss occurs.
Read More →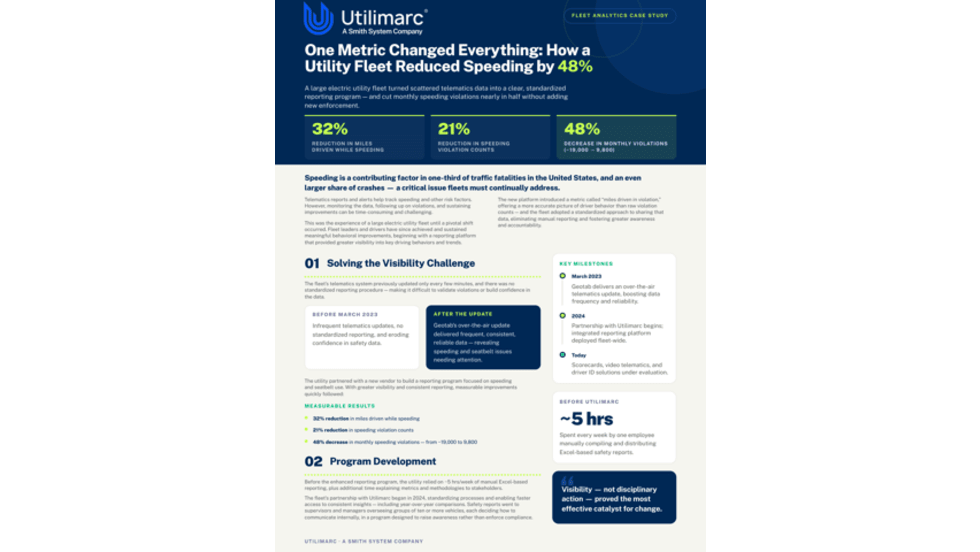
Sponsored•July 17, 2026
How Better Visibility Cut Speeding Violations by 48%
Fleet leaders don't need more data, they need clearer visibility into what the data is saying. This case study explores how one utility replaced speeding-event counts with a single metric — miles driven in violation — to strengthen safety and significantly reduce speeding violations.
Read More →
13 Safe Driving Tips for Commercial Vehicle Drivers
Make sure you are spending time on the road safely with these important tips.
Read More →