

Learn More: Using Training & Tech to Transform Driver Habits
Metrics That Matter: KPIs Driving Work Zone Safety
Discover key KPIs that drive work zone safety and boost ROI. Learn how to track, analyze, and improve safety initiatives for a more efficient and secure jobsite.
by Daniel Venezuela, AWP Safety
October 24, 2024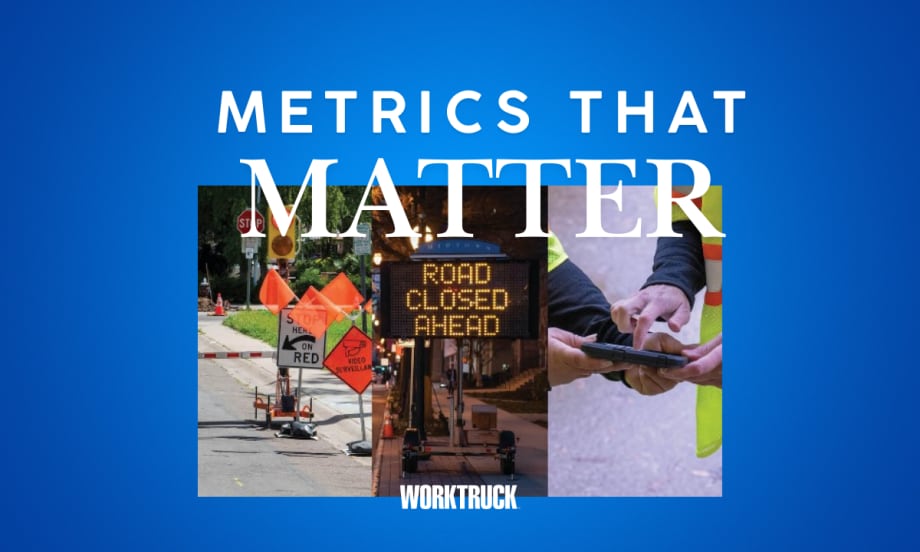
Ensuring work zone safety through real-time monitoring and proactive safety measures helps create a more secure environment for all team members on-site.
Photo: Work Truck | AWP Safety
8 min to read
Construction comes with its fair share of risks, and at AWP Safety, we know that building safe work zones is about ensuring everything operates efficiently on-site. As one of the country's leading traffic control companies, Key Performance Indicators (KPIs) are a big part of how we track safety. They give us a starting point, show us where we're making progress, and highlight where we can do better.
Here's how to gather the most important KPIs and calculate your safety initiatives' return on investment (ROI).
Tracking Incident Frequency: How to Reduce Work Zone Accidents
One of the main things we keep an eye on in work zones is how often incidents happen. We measure this using OSHA's Total Reportable Incident Rate (TRIR). To calculate TRIR, multiply the number of injuries or illnesses by 200,000, then divide by the total hours worked by all employees.
For example, if a company has five reportable incidents in a year and workers put in 400,000 total hours, you'd use the formula (5 × 200,000) ÷ 400,000, which gives a TRIR of 2.5. This means the company had 2.5 incidents for every 100,000 hours worked. In the realm of construction activity, a TRIR under 3.0 is considered sound, while anything over 5.0 suggests there could be some safety issues that need attention.
Using this standard method makes it easier to compare safety across different jobsites. Regularly tracking these incidents also helps us see if certain times of day, tasks, or stages of a project are linked to more problems, which means we can step in and fix things before they get worse.
Near Misses and Good Catches: Proactively Preventing Work Zone Hazards
We always encourage our traffic safety teams to speak up about near misses and good catches so we can spot potential problems before they turn into something bigger.
For example, if a worker is nearly struck by a passing vehicle, we term it a near miss. On the other hand, if someone spots a traffic cone in the wrong spot and moves it before it becomes a problem for drivers, that's a good catch. Even though no one got hurt, these situations show where there might be gaps in our safety measures that need attention.
Getting our teams to report near misses and good catches helps build a culture where everyone stays sharp and takes ownership of keeping the jobsite safe.
It's important that every worker feels safe raising concerns without worrying about getting into trouble. In construction zones, we can track these near misses and good catches by:
Training: This starts by clearly defining what constitutes a near miss/good catch and extends to the importance of conducting Pre-Job Safety Briefings before the start of every shift, reporting near misses/good catches, and exercising one's stop-work authority when necessary.
Reporting: Digital reporting tools accessible from the jobsite allow workers to describe incidents in detail, including conditions and/or actions leading up to the event.
Communicating: Along with Pre-Job Safety Briefings, you might want to set up company-run online forums where team members can discuss near misses and good catches. This way, everyone can learn from each other and work together to improve safety.
CAPA in Work Zones: Correcting and Preventing Safety Risks
Corrective Actions/Preventive Actions (CAPA) is a KPI that helps us gauge how well we've addressed or reduced risks after an incident, audit, jobsite inspection, or Pre-Job Safety Briefing, and includes a few essential aspects:
Immediate Rectification: These fast fixes temporarily reduce risks until a permanent solution can be implemented. For example, if a traffic light within a work zone fails, a temporary stop sign may be employed until the light can be repaired.
Root-Cause Analysis: We take a step-by-step approach to discover what's really behind a safety issue. From the traffic control plan to the people to the process, when one of these elements is misaligned, it can lead to problems. Sometimes, cultural shifts are required, like changing behaviors, which can come from better training or clearing up misunderstandings. Our constant goal is to address the fundamental issues rather than the symptoms. For example, a root-cause analysis might reveal that poorly placed signs are confusing drivers in a work zone where multiple accidents have occurred.
Documentation: Closely tracking and documenting the problem, the fix, and how things go afterward ensures our solutions have the intended effect. For instance, AWP Safety may document the deployment of new crash cushions around a high-risk bend by tracking accidents before and after the installation.
It's important to allow workers to say if the changes work and make sense in their day-to-day tasks. Hearing from the crew ensures that the safety steps are easy to follow and have the intended impact. This also builds a team mindset where everyone feels like they play a part in looking out for their own safety and their coworkers', too.
Employee Engagement in Safety Protocols: Strengthening Work Zone Culture
We also make it a point to track how involved our teams are in following protocols to give us a sense of how solid our safety culture is performing.
We look at things like who's completing their training, showing up for safety meetings, participating in drills, using their PPE properly, and reporting any incidents.
This feedback and data give us a better idea of where we might need to make some adjustments. If, for example, a certain group isn't attending safety meetings as often, it could mean the times aren't working, and a change to the schedule is in order. Or, where PPE is being misused, it might reveal the need to provide better training or clearer instructions.
Harnessing Data to Improve Work Zone Safety: Collect, Analyze, Act
Collecting and analyzing safety data is crucial for keeping our work zone safety programs running smoothly, and technology has made this process simpler and more efficient.
Nowadays, safety managers can use mobile apps to easily collect, save, and track data, which helps cut down on the delays and mistakes that can happen with manual paperwork. These apps let our safety officers report incidents from the jobsite, upload pictures of any hazards, and instantly alert their team.
The Internet of Things (IoT) is also changing the way we handle safety, connecting devices so they can work together to make worksites more secure. For example, sensors integrated into traffic cones can monitor and record traffic density and flow, and some devices can also detect hazards and irregular driving behaviors that present risks.
Wearables like GPS-enabled helmets, vests, and wristbands with biometric sensors are also starting to show up more on jobsites. These devices help by keeping track of vital signs, like heart rate and body temperature, which can prevent issues like heat stress. Some wearables also keep tabs on where workers are within a construction zone and alert them if they move into dangerous spots.
Effective data analysis helps companies pinpoint recurring issues and focus on the most urgent problems. This allows for the refinement of procedures, improvement of training, and redirection of resources to the areas that will benefit them most.
Calculating ROI for Safety Programs: The Financial Benefits of Safer Work Zones
To calculate the ROI of safety initiatives, you must consider direct financial gains and less obvious factors. Here's how you can assess the impact of a safety program, starting with the most immediate benefits:
Fewer Accidents and Lower Severity: When there are fewer injuries, whether minor or severe, companies see a reduction in compensation claims. This directly cuts the costs associated with handling those claims.
Lower Insurance Costs: Companies with lower incident rates often experience a reduction in insurance premiums. Insurance companies typically evaluate a firm's Experience Modification Rate (EMR) when setting premiums. EMR is calculated based on the frequency and severity of workers' compensation claims filed over a standard observation period, typically the last three years of a company's claims history, excluding the most recent year. The formula compares the actual incurred claims to what is expected for companies with similar payroll sizes and types of work.
An EMR greater than 1.0 indicates a worse-than-average claim history, leading to higher premiums, whereas an EMR less than 1.0 signifies a better-than-average history, resulting in lower premiums. For example, if a company's EMR is 1.20, it pays 20% more in premiums than the average company in its industry. Conversely, an EMR of 0.85 would mean the company pays 15% less than the average.Fewer Days Lost to Injuries: When safety programs work well, fewer people get hurt, which means employees miss less time, and you don't have to worry about hiring temps or paying overtime to cover shifts. Keeping your regular team in place also means projects stay on schedule, making you less likely to face delays or penalties for finishing late.
A safer workplace also keeps morale high and helps with employee retention, saving money on constantly recruiting and training new hires. A strong safety record can also open doors to new business and help avoid fines or legal issues.
To figure out the return on your safety investment, here's how you can break it down:
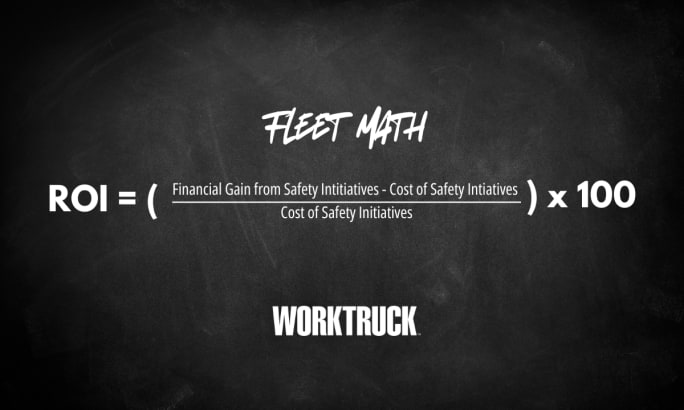
An ROI equation for fleet managers.
Photo: Work Truck
ROI Calculator
ROI will be shown here.
Editor's note: The calculator above was generated by AI and is a tool for test scenarios only. Please refer to a more comprehensive ROI calculation for in-depth insights.
Money saved ("Financial Gain") includes:
Lower insurance premiums.
Reduced costs from fewer accidents.
Indirect perks like better productivity and less turnover.
What you spend ("Cost of Safety") covers all the costs associated with safety programs, such as training, new equipment, or system upgrades.
Suppose a construction company spends $500,000 on new work zone safety training, equipment, and software to collect and analyze the data. In the following year, they see a reduction in accident-related costs of $300,000 and lower insurance premiums, saving $150,000. Include indirect benefits like increased productivity and reduced turnover; you can add another $100,000 in savings. The ROI calculation would be:
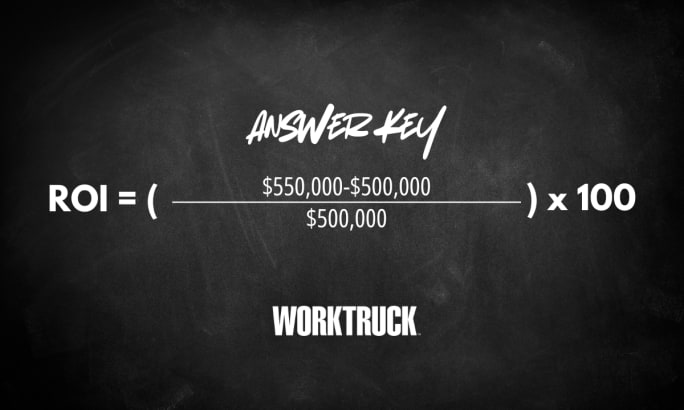
A sample ROI equation for fleet managers resulting in a 10% ROI.
Photo: Work Truck
Achieving a 10% ROI means that for every dollar the company invests in safety, it gets an additional ten cents back. This shows that investing in safety isn't just ethical — it's also a smart financial decision.
Safety KPIs are key to shaping and enhancing safety practices in construction. When companies collect, review, and act on this data, they can manage risks better on jobsites and make their operations more efficient, leading to a safer work environment and smoother day-to-day activities.
About the Author: Daniel Venezuela serves as general manager for the Texas region at AWP Safety. In this role, he partners with business unit vice presidents to enhance the efficiency and safety of AWP’s regional operations. Venezuela also leads strategic projects and initiatives, playing an active role in optimizing daily activities.
Subscribe to Our Newsletter
More Safety

Sponsored•August 1, 2026
Top 50 Executive Fleets
It is that time of year again! Time for the 2026 list of the Top 50 Executive Fleets, presented by Automotive Fleet and Volvo as part of its annual Fleet 500. Download now to see this year's list of companies!
Read More →
Applause & TRUCE Software Partner to Improve Driver Safety Through AI-Powered Telematics & Employee Performance Management
Applause has integrated TRUCE driving metrics directly into its employee-first performance and safety platform that transforms mobile devices into AI-powered telematics.
Read More →
How Detroit Assurance with Active Brake Assist Works
Do you want to see what it is like to experience Detroit Assurance’s Active Brake Assist? In this video, Work Truck will put you in the cab to see how it all works and then hear more details from DTNA’s Mike Young.
Read More →
Get Left of Loss: A 5-Step Workplace Prevention Framework for Fleet Operators
Violence risks do not stop at the driver’s door. Learn five practical steps fleets can take to spot threats early and protect workers before loss occurs.
Read More →
Sponsored•July 17, 2026
How Better Visibility Cut Speeding Violations by 48%
Fleet leaders don't need more data, they need clearer visibility into what the data is saying. This case study explores how one utility replaced speeding-event counts with a single metric — miles driven in violation — to strengthen safety and significantly reduce speeding violations.
Read More →
13 Safe Driving Tips for Commercial Vehicle Drivers
Make sure you are spending time on the road safely with these important tips.
Read More →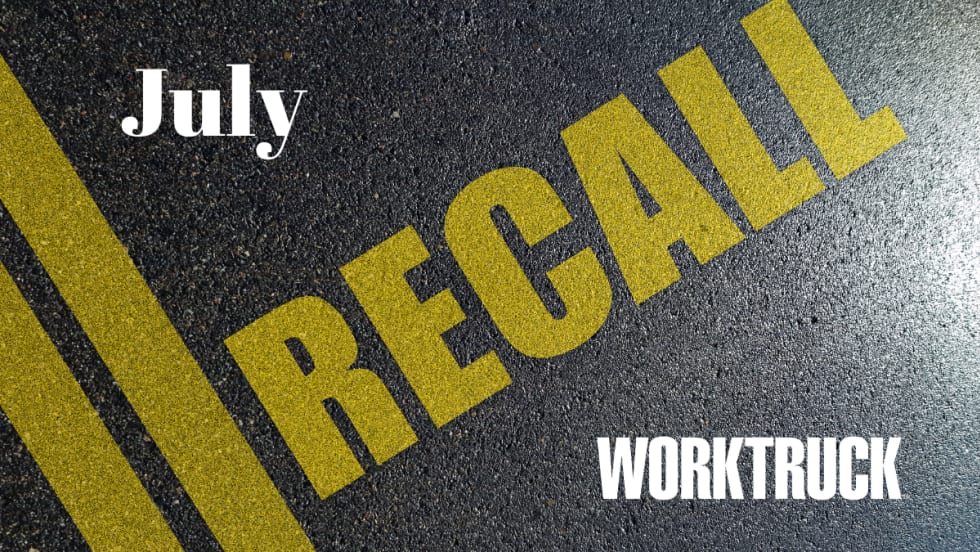
Recalls You Need to Know About in July 2026
If you have Altec, Ford, General Motors, Harbinger, Hyundai, Mack Trucks, or Volvo Trucks vehicles in your fleet, you should check these important recalls issued by the National Highway Safety Administration.
Read More →
How Telematics Is Transforming Fleet Risk from Insight to Action
What if you could spot risky driving before it leads to a crash? See how telematics is still changing fleet safety today.
Read More →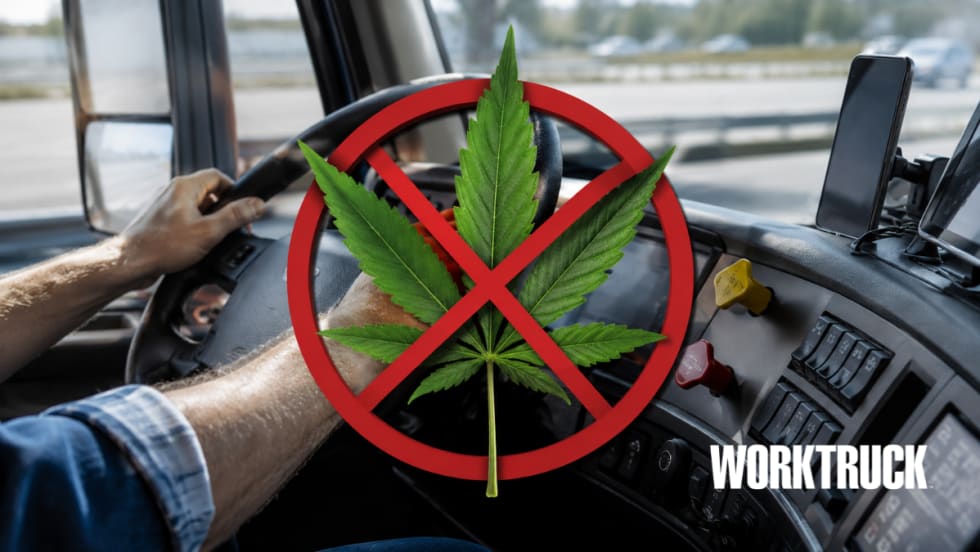
DOT Rules Remain Firmly Lit on Marijuana
DOT says not so fast on marijuana. Even with federal reclassification efforts, commercial drivers in safety-sensitive roles remain subject to marijuana testing and prohibitions.
Read More →
Lytx Adds Fleet Management Enhancements to LytxOne Platform
Lytx has added new features to LytxOne to bring safety, operational insight, asset visibility, and compliance into a unified, all-in-one platform.
Read More →