




Related: Webinar - Understanding the Last-Mile Delivery Market
13 KPIs that Define Last-Mile Delivery Success
To run a profitable last-mile delivery fleet, operators need to act on consumer-driven trends and measure key performance indicators around productivity, customer satisfaction, and revenue and cost.
May 16, 2021

In today’s market, “free and fast” are table stakes. KPIs such as average service time by customer, actual versus planned, drive versus service time, and off-day deliveries must be measured and acted upon to drive a profitable operation.
Image via publicdomainpictures.net/mohamed mahmoud hassan.
6 min to read
If you’re a last-mile delivery fleet operator, the old rules still apply: Managing vehicle depreciation, retaining drivers, mitigating crashes, and increasing uptime will put you on the path to a profitable operation. Yet the mission-critical nature of your business — managing the delivery of over 300 packages per driver in a 10-hour period — necessitates attention to a specific set of KPIs (key performance indicators) to measure success.
In a webinar on the last-mile delivery market convened May 4, two subject matter experts, Jim Blaeser, director at AlixPartners, and Cyndi Brandt, vice president of sales enablement at Omnitracs, a fleet intelligence platform provider, defined these new leading indicators for last-mile delivery fleets.
Three Trends in Last-Mile Delivery
Using data from an annual AlixPartners survey on home delivery, Blaeser outlined three consumer-driven trends in last mile that are in large part driven by the “Amazon Effect” and the expectation of fast and free delivery. Last-mile delivery operations must react accordingly. “What consumers want will ultimately drive the market and drive what fleet operators need to provide,” he said.
1. Shrinking Delivery Times
The survey queried consumers on expectations for delivery speed and their maximum acceptable days to wait for free delivery. Since 2012, that expectation has shrunk 40%, from 5.5 days to 3.3 days. By the next survey in 2022, AlixPartners expects the window to shrink by another 15% to 2.8 days.
“This means that fleet operators need to provide more service on a timelier basis and utilize new technologies to meet the tightening window in which the deliveries need to be made,” Blaeser said.
2. Expansion of Product Categories
AlixPartners divides the evolution of last-mile deliveries into waves. Looking at trends in product categories, the first wave (pre-2014) represented products that were discretionary, small, and of low value. Transaction integrity was a key concern.
In the next wave, from 2014 until 2020, product categories grew to every day-use items and consumer staples. Speed of delivery was a differentiator. In the last 12 months, each of the eight product categories — apparel & footwear, food (groceries/frozen), cleaning supplies, books/media, pet supplies, cosmetics, small electronics & accessories, and health & medical supplies — grew, while food (37%), cleaning supplies (34%), and health & medical supplies (45%) increased the most.
In the post-pandemic third wave, the type of products delivered is becoming more varied to include high value and perishable items. Blaeser tied the growth of the health and medical supply category around the rise of telemedicine, and sees this trend continuing post-pandemic.
The size of delivered products is growing as well. “More people working and shopping from home during the pandemic drove a greater adoption of bigger, bulkier, items,” Blaeser said. “Those larger products have different characteristics and needs associated with them.”
To meet this new product mix, Blaeser said fleet operators should focus on the right amount of equipment to meet demand. That also includes the right type of equipment, from delivery vans and box trucks to upfits within the trucks that hold and organize the products.
3. Value-Added Services
The expansion of product types has opened the door to the next evolution of home delivery — providing value-added services above and beyond dropping off the item.
This could entail installation or setting up the delivered item, from big-screen TVs to home exercise equipment. “Add-on services such as installation, assembly, and technical services offers a new revenue frontier for delivery companies,” Blaeser said.
AlixPartner’s data shows that interest in value-added services has risen steadily since 2014 but flattened during pandemic. Blaeser thinks this demand will reignite. “Convenience becomes the next frontier for delivery providers to meet the ‘do-it-for-me’ economy,” he said.
Fleet operators will need to pay more for drivers who can leverage product knowledge and represent the products’ brands in the home. While an added payroll burden, the operators who meet the challenge will set themselves apart from a commoditized market and can realize higher fees.
Regarding the three trends generally, “If you're not automating or using technology to drive efficiencies in your fleet operations, you're not going to be competitive in this new market,” Blaeser said.
KPIs that Matter
Omnitrac’s Brandt said last-mile delivery operators must always maintain focus on these big-picture items:
reasonable working conditions for drivers through distributed workloads, sensible route planning, and enough time to complete the deliveries;
a quality customer experience in terms of on-time deliveries, with the right product orders undamaged; and
delivering shareholder assurances by maximizing efficiencies and minimizing waste and costs.
Brandt then put last-mile delivery KPIs into categories of productivity, customer satisfaction, and cost and revenue.
“Why do we need key performance indicators?” she asked. “Because you can't manage what you don't measure.”
1. Productivity
Brandt said the most important productivity KPI, actual versus planned, means understanding the difference between the plan created and the execution of that plan. Routes that consume more hours or miles to complete drive unexpected costs and must be addressed.
Average service time by customer is designed to spot inefficient customers, “the ones for which you’re spending too much or too little time,” Brandt said.
Drivers might be over-servicing customers by making an extra delivery or service call to a client that isn't on the record for that day. “Or maybe they're even taking calls directly from customers,” Brandt said, “which can be very inefficient and costly in the long run.”
Average delivery distance, drive versus service time, and fuel consumption should also be measured. “With delivery costs from $1.50 to over $2 per mile, “It gets very expensive if they are driving too many miles,” Brandt said.
2. Customer Satisfaction
A high ratio of on-time deliveries is an important KPI for end users as well as retailers for which operators are providing services at the delivery point.
Dig deeper into the causes of delays. “How long were you detained at a customer?” Brandt asked. “Did you arrive on time but have to wait for a check or wait for a dock door to open?” Identifying these causes will allow you to renegotiate time windows with your customers or moving delivery days.
Off-day deliveries are very expensive, Brandt said. They can be caused by a customer asking for a special delivery or an inattentive salesperson who didn't get the full order. Some customers simply take advantage of the situation and feel they don't have to put their entire order at one time. Understanding this metric becomes a tool in customer negotiations to either consolidate orders or change delivery windows.
For customer complaints, understand your ratio to total number of deliveries. “It’s really important to understand that percentage and track it over time,” Brandt said.
Measuring KPIs around the customer experience allows operators to create a scorecard for their customers. “You need to promote to clients how effective and efficient you are to solidify your brand in their mind to get the baby to potentially give you more business,” she said.
3. Revenue and Cost
Cost per mile and cost (revenue, profit) per stop are intertwined to demonstrate most and least profitable customers, with utilization rate a factor. With that, operators can apportion delivery options to those customers accordingly. “It's also a great way to negotiate with retailers for your best white glove service,” Brandt said.
Measuring missed deliveries and order accuracy is also important. “If you have to go back to a customer you’ve already visited, you’ve just double your delivery costs,” she said.
Finally, Brandt referenced the 80/20 rule, in which 80% of your problems are traced back to 20% of the causes. “Don't over KPI,” she said. “Figure out which KPIs work specifically for you to tell the right story.”
Topics:Last-Mile Deliverymetricskey performance indicators (KPIs)OmnitracsTechnology & AIOperationsDeliverySmall Fleet
Originally posted on Automotive Fleet
Subscribe to Our Newsletter
More Technology & AI

The Second Trip and What Missing Tools Really Cost a Service Business
For service fleets, missing tools and equipment can lead to second trips, lost technician time, higher operating costs, and delayed jobs. Equipment tracking can help HVAC, plumbing, electrical, landscaping, and other service businesses improve visibility and reduce downtime.
Read More →
GeoFencing Adds to Your Truck Security Arsenal
Geofencing is a familiar fleet tool today, but its early adoption marked a major shift in vehicle tracking, route monitoring, and the debate over employee privacy.
Read More →
Geotab Data Shows Regional Trucking Growing Faster as Last Mile Routes Get Denser
Geotab's first U.S. supply chain report finds stable long-haul activity, stronger regional freight movement, tighter hub-and-spoke utilization, and more last-mile trips on shorter routes.
Read More →From Our Partners
Basic Tracking vs Next Generation Fleet Technology
Sponsored by AT&T Business

5 Facts Every Fleet Manager Should Know About Embedded Telematics
Sponsored by Stellantis/Mobilisights
How AI Video Telematics Boosts Driver Safety and Helps to Avoid Unnecessary Costs
Sponsored by Verizon Connect
Charting the 8 Bottom-Line Benefits of Workforce Optimization
Sponsored by Verizon Connect


When Fleet Technology Helps and When It Just Adds Complexity
New technology can help fleets work smarter, but only if it solves the right problem. Lauren Fletcher talks with AP Fleet’s Alex Coveney about innovation, AI, data, and knowing when a new solution is actually worth adopting.
Read More →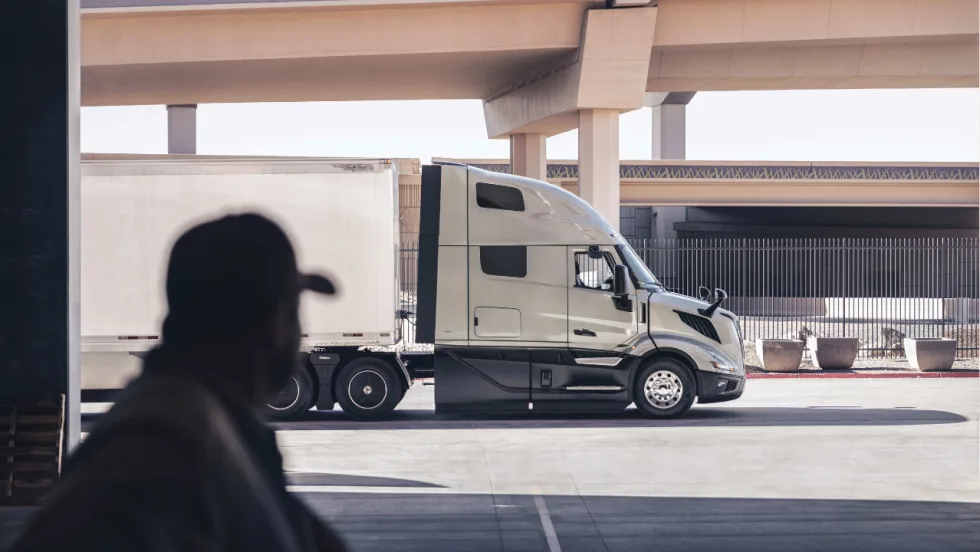
Volvo Trucks’ 'Lock and Leave' Software Updates Go Live Across North America
Unattended over-the-air software updates are now available in Volvo trucks across the U.S. and Canada. The new capability lets trucks stay current with the latest software without interrupting operations or requiring a dealership visit.
Read More →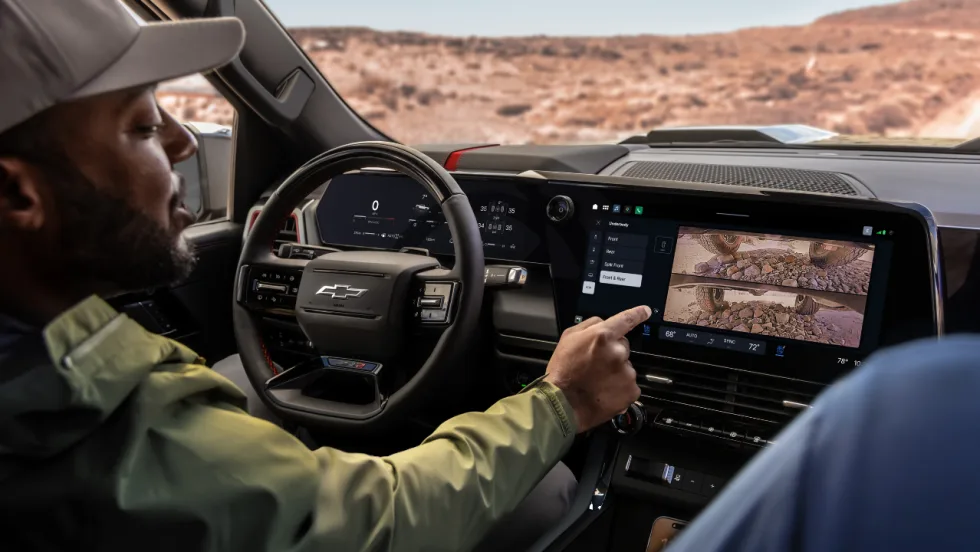
GM Brings New Truck Focused Interface to 2027 Silverado and Sierra
GM's new pickup interface puts trailering data, camera views, vehicle controls, and smartphone integration closer to the driver in the 2027 Silverado and Sierra.
Read More →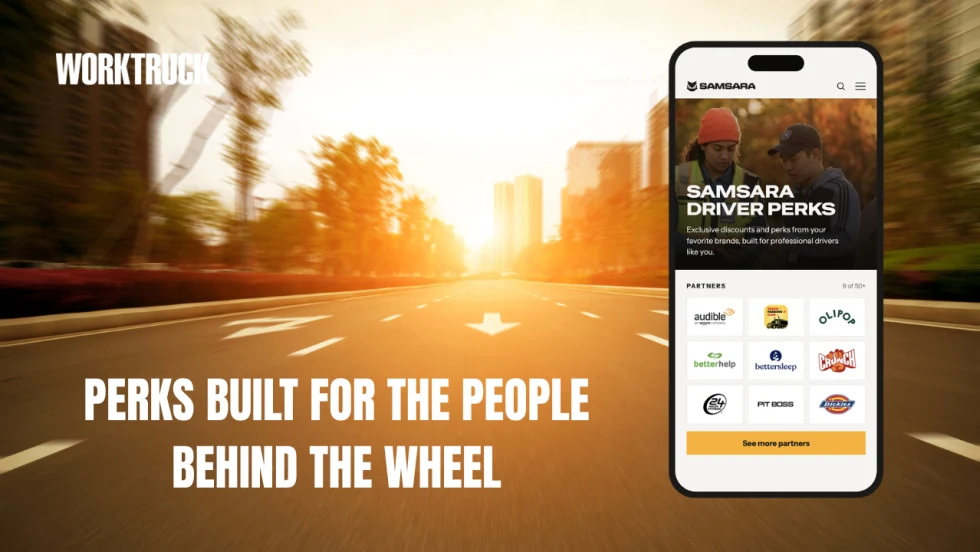
Samsara Driver Perks Expands Rewards Beyond the Long Haul Driver
Samsara’s new driver rewards program was built with a broader professional driver in mind, including employees who split their day between driving, job sites, service calls, and other work.
Read More →
AI Service Advisor Aims to Cut Fleet Repair Downtime
Fleetio said its AI Service Advisor can help fleets cut repair downtime by an average of 2.5 hours per repair while reducing manual maintenance work.
Read More →
Verra Mobility Launches AI-Driven Title & Registration Solution
Verra Mobility has launched a new AI-driven Title & Registration platform to help fleets move vehicles from acquisition to the road the same day while reducing compliance risk.
Read More →
Wialon Unlocks OEM Data to Give Fleet Owners Data Ownership & Operational Clarity
Wialon has introduced hardware-free OEM integration as the EU Data Act accelerates the shift in vehicle data access across the fleet industry in many countries.
Read More →