The report also reveals 2021’s riskiest states, cities, and roadways for driving in the United States — as well as the riskiest days and times to be on the road.
These insights were derived from Lytx’s proprietary database of commercial vehicle driving data from 2019 through 2021, including more than 14 million risky fleet vehicle-driving events captured last year.
Photo: Lytx
5 min to read
Lytx released its fourth annual “State of the Data” report on vehicle fleets. The report's data shows drivers using the Lytx Driver Safety Program experienced fewer collisions, despite an increase in risky driving on the United States roadways in 2021. The report also reveals 2021’s riskiest states, cities, and roadways for driving in the United States — as well as the riskiest days and times to be on the road.
Ad Loading...
“In 2021, we boosted investments in our technology, innovations, partnerships, and people to acquire even more intelligence about transportation on our roadways,” said David Riordan, Lytx’s Executive Vice President and General Manager, Enterprise. “We captured more than 35 billion miles of driving data last year, bringing our total dataset to over 185 billion miles. We analyze this data to help vehicle fleets better understand the risks on the road and the driver behaviors that can have a positive effect on safety.
Ad Loading...
Navigating Hazardous Roadways
According to a report released by the National Highway Traffic Safety Administration in February 2022, a statistical projection of traffic fatalities for the first nine months of 2021 showed a 12% increase in fatal traffic crashes nationwide, compared with 2020. The report estimated that 31,720 people died in motor vehicle traffic crashes during the first nine months of 2021, compared with 28,325 fatalities in the same period in 2020.
ABC News reported that NHTSA has blamed reckless driving behavior for increased traffic fatalities during the pandemic, citing that behavioral research showed an increase in speeding and traveling without a seat belt.
Despite the elevated risks in 2021, companies that used Lytx’s fleet management services last year improved their overall safety levels, demonstrating significant reductions in several critical, high-risk behaviors.
The top five reduced risky behaviors (in order):
Not driving on a designated roadway
Driving too fast for conditions
Late response to a hazard or a change in road conditions
Failure to use mirrors
Running a red light
Ad Loading...
Lytx’s DriveCam Event Recorders use machine vision and artificial intelligence (MV+AI) technology that can help address distracted driving in the moment, and provide reliable, continual video evidence for protection when the unexpected occurs. DriveCam Event Recorders automatically detect 11 risky driving behaviors inside and outside the vehicle.
The data also revealed increases in certain risky behaviors that fleet managers can address in their companies’ safety programs.
The top five increased risky behaviors (in order):
Electronic device distraction (non-cellphone)
Driver unbelted while driving off an identifiable roadway
Cellphone distraction
Posted speed violation
Distractions other than electronic devices (e.g. food or drink)
The top five associated behaviors in near collisions (in order):
Ad Loading...
Failed to keep adequate space around the vehicle
Distractions other than electronic devices (e.g. food or drink)
Failure to use mirrors
Driver fails to scan an intersection adequately before entry
Late response to a hazard or a change in road conditions
The top five associated behaviors in collisions (in order):
Driver took a risky action (e.g. taking hands off wheel for more than three seconds)
Failed to pay attention
Driving too fast for conditions
Failure to use mirrors
Distractions other than electronic devices (e.g. food or drink)
Riskiest Days and Times for Fleet Drivers
The day of the week that drivers are on the road can make a difference in risky roadways, as Lytx data found new insights regarding the days of the week and times that have the highest prevalence of collisions.
Lytx data found that fleet drivers had the most collisions in 2021 on Friday, changed from Tuesday in 2020. Sunday remains the day with the fewest collisions.
Photo: Lytx
2021
2020
2019
Day with most collisions
Friday
Tuesday
Thursday
Day with fewest collisions
Sunday
Sunday
Monday
Time of day with most collisions
Morning (5 a.m. to noon)
Morning (5 a.m. to noon)
Morning (5 a.m. to noon)
Industry Spotlight – Emergency Medical Services (EMS)
Considering that 2021 was a year filled with increased risk on the roadways due to higher traffic levels than in 2020, nearly all industries experienced an increase in risky driving behaviors.
The EMS industry, however, saw no change in its risky behavior count from 2020 to 2021 and it was the overall lowest-ranked industry in 2021, in terms of risky behavior.
Additionally, EMS was the second-lowest ranked industry in near-collision counts in 2021, maintaining the same ranking as 2020, when there was considerably less risk on the roadways.
For a sector that has been stressed and heavily relied upon for its essential work during the past two years, these EMS achievements spotlight more remarkable work being done by medical professionals.
The Riskiest States
These states and district are at least 1.5 times riskier than other states due to their large populations, high traffic volumes, and unusual traffic patterns. The top five riskiest (in order) for commercial fleets in 2021 were:
Ad Loading...
New York
California
Nevada
Massachusetts
District of Columbia
The top five riskiest states for fleets in 2020 were:
California
Washington
Texas
Oregon
Georgia
There are multiple reasons for the increase in some states in 2021, as compared with 2020, but COVID-related lockdowns were likely a significant factor. For example, New York was more locked down for COVID reasons in 2020, while Texas and Georgia were less so.
The Riskiest Cities
These cities and metropolitan areas are riskier due to their size, greater traffic density, and quickly changing driving conditions. The top five riskiest for vehicle fleets in 2021 were:
Ad Loading...
New York, N.Y., and Newark, N.J. (N.Y./N.J. is 28% riskier than Chicago)
Chicago
Los Angeles, Long Beach, and Anaheim, Calif.
Atlanta
Philadelphia
The Riskiest Roads
Lytx captured more than 14 million risky driving incidents among vehicle fleets in 2021. Road segments were examined using Lytx’s proprietary risk-scoring system, and the data identified that the riskiest roadways in the U.S. for 2021 were:
Interstate 94 near West G. Rogell Drive (near Detroit Metropolitan Wayne County Airport in Romulus, Mich.)
U.S. 422 near Mercer Road (Butler, Pa.)
U.S. 422 near Glade Drive (Kittanning, Pa.)
Interstate 95 near the Port of New Haven (New Haven, Conn.)
U.S. 422 near East Butler Road (Butler, Pa.)
These five roadway segments are 220 times riskier than the average roadway. Most of these road segments are either narrow or are near interchanges, construction zones, or on/off ramps.
The top five types of unsafe driving in those areas are:
Speeding
Rolling stop
Rough/uneven surface
Braking
Following distance
Ad Loading...
The top five risky driver behaviors in those areas are:
Posted speed violation
Driving unbelted on roadways
Unbelted incidents
Incomplete stop
Failed to stop
“Lytx’s annual State of the Data report gives our clients and our company valuable insights in the effectiveness of our safety services, and where we can improve,” said Gary Johnson, Lytx Director of Safety Services. “In an ever-challenging transportation landscape, it’s more important than ever that we continue innovating and developing tools to help keep our fleet drivers safe and aware of the risks around them.”
It is that time of year again! Time for the 2026 list of the Top 50 Executive Fleets, presented by Automotive Fleet and Volvo as part of its annual Fleet 500. Download now to see this year's list of companies!
Applause has integrated TRUCE driving metrics directly into its employee-first performance and safety platform that transforms mobile devices into AI-powered telematics.
Do you want to see what it is like to experience Detroit Assurance’s Active Brake Assist? In this video, Work Truck will put you in the cab to see how it all works and then hear more details from DTNA’s Mike Young.
Violence risks do not stop at the driver’s door. Learn five practical steps fleets can take to spot threats early and protect workers before loss occurs.
Fleet leaders don't need more data, they need clearer visibility into what the data is saying. This case study explores how one utility replaced speeding-event counts with a single metric — miles driven in violation — to strengthen safety and significantly reduce speeding violations.
If you have Altec, Ford, General Motors, Harbinger, Hyundai, Mack Trucks, or Volvo Trucks vehicles in your fleet, you should check these important recalls issued by the National Highway Safety Administration.
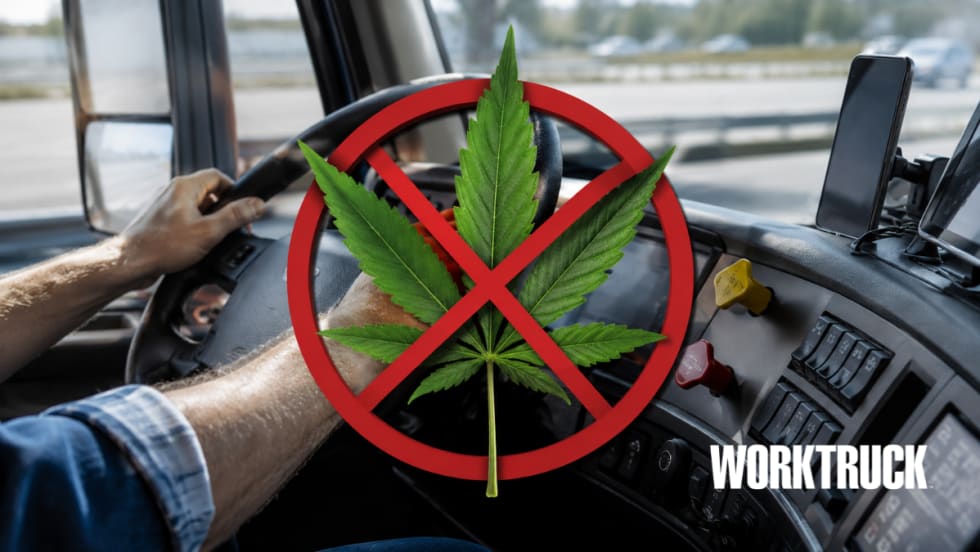
DOT says not so fast on marijuana. Even with federal reclassification efforts, commercial drivers in safety-sensitive roles remain subject to marijuana testing and prohibitions.