

TomTom Traffic Index 2024 Shows U.S. Cities with Increased Congestion and Slower Speeds
New York drivers lost 94 hours to congestion in 2024! Explore the latest traffic trends and how fleet managers can combat rising delays.

Urban congestion is on the rise! TomTom’s 2024 Traffic Index reveals how U.S. cities rank in travel delays and what it means for fleet operations.
Photo: Work Truck | Tom Tom
TomTom's 14th annual Traffic Index has revealed notable trends in urban mobility across the globe, with U.S. cities experiencing a 9% increase in traffic congestion compared to 2023. Analyzing traffic data from 500 cities in 62 countries, this year’s report is TomTom’s most extensive yet, providing fleet managers with actionable insights to navigate today’s transportation challenges.
In the U.S., urban centers like New York, Los Angeles, and Miami topped the rankings for congestion and travel delays. With freight traffic rising alongside e-commerce demand, the report highlights critical areas for optimization in fleet logistics and route planning.
Rising Congestion Across the U.S.
The 2024 report shows an increase in congestion levels across major U.S. cities, complicating mobility for fleets and commuters alike. Notable findings include:
New York City remains the slowest city for travel, with a 6-mile trip averaging 30 minutes at just 12 mph.
Providence, Rhode Island, saw the largest congestion increase, jumping 50% compared to 2023.
Los Angeles had the highest congestion level at 43%, with some areas like Santa Monica exceeding 52%.
Top 10 U.S. Cities with the Slowest Average Speeds (2024)
Rank | City | State | Average Travel Time (6 miles) | Avg Speed (2024) | Avg Speed (2023) | Change (%) |
|---|---|---|---|---|---|---|
1 | New York | NY | 30:01 | 12.0 mph | 12.2 mph | +2.3 |
2 | San Francisco | CA | 25:37 | 14.0 mph | 14.4 mph | +1.9 |
3 | Honolulu | HI | 19:56 | 18.0 mph | 18.2 mph | +0.6 |
4 | Chicago | IL | 19:10 | 18.8 mph | 19.3 mph | +3.0 |
5 | Philadelphia | PA | 18:54 | 19.0 mph | 19.7 mph | +3.4 |
6 | New Haven | CT | 18:38 | 19.3 mph | 19.7 mph | +2.1 |
7 | Columbia | SC | 18:25 | 19.5 mph | 19.7 mph | +0.9 |
8 | Washington | DC | 17:56 | 20.1 mph | 20.6 mph | +2.8 |
9 | New Orleans | LA | 17:37 | 20.4 mph | 21.1 mph | +3.4 |
10 | Miami | FL | 17:03 | 21.1 mph | 21.8 mph | +3.2 |
Traffic Impacts on Fleet Management
For fleet managers, the increase in congestion means higher costs, longer delivery times, and more fuel consumption. Key insights for fleet operations include:
Time Lost in Traffic: In New York City, fleet drivers lost an average of 94 hours to peak-hour congestion in 2024, a 5.5% increase from 2023.
Cost Implications: Increased travel times and delays elevate operational expenses, particularly for last-mile deliveries.
Dynamic Routing Solutions: Leveraging traffic data can help mitigate delays by enabling dynamic rerouting and smarter scheduling.
Top 10 U.S. Cities with the Highest Congestion Levels (2024)
Rank | City | State | Avg Congestion Level (2024) | Change from 2023 |
|---|---|---|---|---|
1 | Los Angeles | CA | 43% | +4.3% |
2 | Honolulu | HI | 34% | +3.7% |
3 | Miami | FL | 33% | +11.0% |
4 | Fort Myers | FL | 32% | +7.0% |
5 | San Francisco | CA | 32% | +6.0% |
6 | Tampa | FL | 32% | +13.1% |
7 | Chicago | IL | 31% | +9.9% |
8 | Seattle | WA | 31% | +11.4% |
9 | Providence | RI | 31% | +48.8% |
10 | Atlanta | GA | 31% | +9.2% |
A Call to Action for Smarter Fleet Solutions
TomTom’s findings emphasize the need for data-driven decision-making in urban mobility. Fleet managers can utilize tools like real-time traffic monitoring and advanced navigation systems to adapt to dynamic traffic conditions. Additionally, proactive investments in driver training, fuel-efficient vehicles, and logistics optimization can help mitigate the financial and operational impacts of growing congestion.
The full 2024 TomTom Traffic Index is available for further insights, offering fleets an invaluable resource to improve route efficiency and operational planning.
More Safety

5 Safe Driving Tips for 4th of July
To ensure that this year’s fireworks remain in the sky and not on the roadway, follow these five easy steps to remain safe on the road this year – shared directly from a truck driver.
Read More →
NSC Marks 30 Years of National Safety Month, Includes Road Safety Focus
The Staying Safe on the Roads topic is one of four weekly focuses in June as the National Safety Council observes the 30th anniversary of National Safety Month. NSC also provides insights on the need for fleets to create a safety policy.
Read More →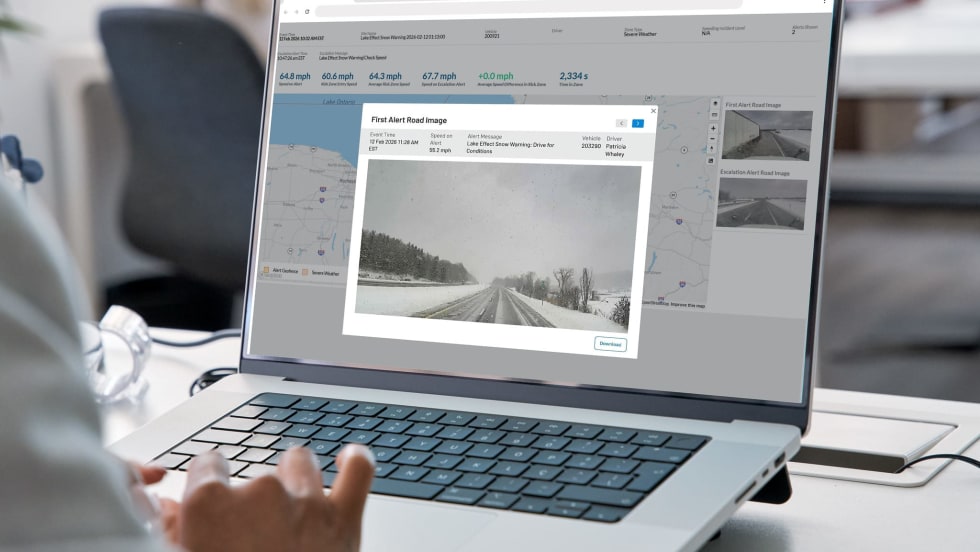
Fleetworthy Integrates Lytx Video Snapshots to Improve Driver Coaching
Fleetworthy’s integration of Lytx video snapshots enables fleet managers to combine visual event evidence with Safety+ risk data, helping them make faster, more informed coaching decisions without leaving the Fleetworthy platform.
Read More →
Recalls You Need to Know About in June 2026
In June 2026, what recalls might impact your fleet? Work Truck has the answers in this comprehensive overview of recent NHTSA recalls.
Read More →
J. J. Keller Safety Professional of the Year Awards Nominations Now Open
J. J. Keller & Associates is accepting nominations for the 2026 J. J. Keller Safety Professional of the Year (SPOTY) Awards. Winners will receive prize packages valued at up to $47,200.
Read More →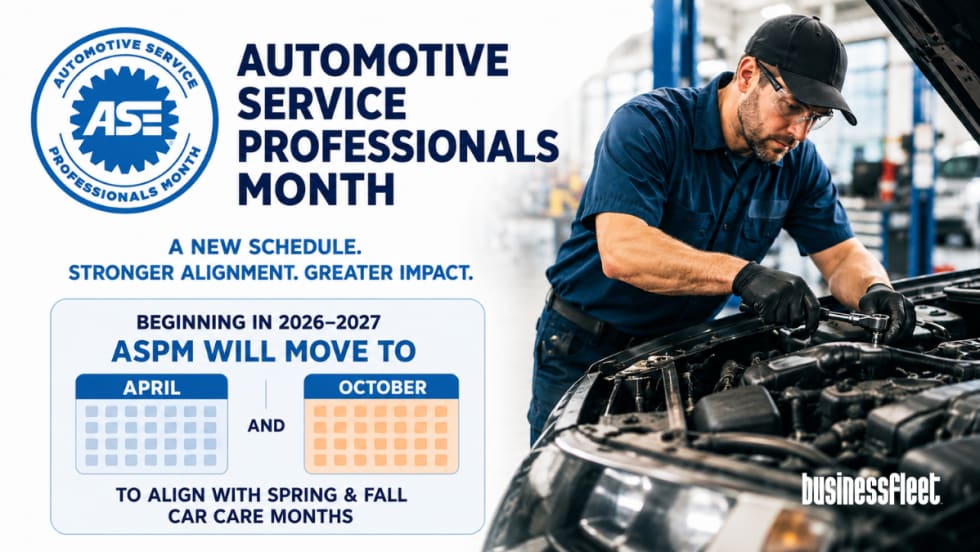
ASE Aligns Automotive Service Professionals Month With Spring and Fall Vehicle Maintenance Campaigns
ASE will move Automotive Service Professionals Month to April and October beginning in 2026-2027, aligning recognition with Car Care Month events.
Read More →
Turning Connected Vehicle Data Into Decisions That Matter
Fleet leaders have more data than ever, but turning that data into clear, actionable decisions remains a challenge. This white paper shows how leading organizations are using connected vehicle data to improve safety, reduce costs, and optimize fleet performance. Learn how to turn insight into action across your fleet.
Read More →
Driver Retention: Motive Automates Driver Coaching & Driver Rewards
New automated rewards and recognition capabilities from Motive can help organizations engage drivers, reinforce positive behavior, and reduce turnover. AI Coach has also been updated to deliver personalized feedback across safety, fuel, and compliance.
Read More →
Experts Forecast Broader Impact of Wildfires in 2026
This year’s wildfire season will likely be more intense than in 2025. The 2026 wildfire forecast from AccuWeather is for fewer fires, but even more acreage will be impacted this year.
Read More →
A Walkthrough of the DataQs Process
Bad data on your carrier record can cost you. Here’s how DataQs helps fleets challenge errors before they hit CSA scores, insurance, and your bottom line.
Read More →