

Report: U.S. Pedestrian Fatalities Remain High
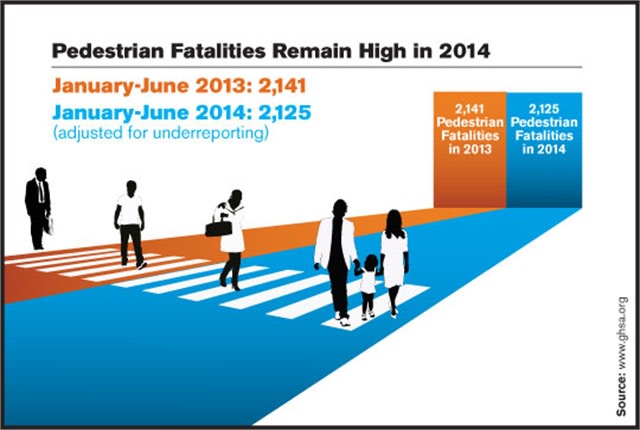
A report from the Governors Highway Safety Association finds that 2,125 pedestrians were killed in the first half of 2014 – essentially unchanged when compared with the 2,141 pedestrian fatalities during the same period in 2013.
Graphic courtesy of GHSA.
Graphic courtesy of GHSA.
A new report concludes that the number of pedestrians killed on American roadways last year likely remained about the same as in 2013, but 24 states and Washington D.C. did see pedestrian fatality decreases in the year’s first half.
Released by the Governors Highway Safety Association, the report analyzes preliminary data provided by the 50 state highway safety offices and the District of Columbia. Dr. Allan Williams, former chief scientist at the Insurance Institute for Highway Safety, compared the number of pedestrian fatalities from the first six months of 2013 and 2014.
Early data indicate a slight (2.8 percent) decrease in deaths. But after factoring in expected undercounting, Williams estimates that 2,125 pedestrians were killed in the first half of 2014 – essentially unchanged when compared with the 2,141 pedestrian fatalities during the same period in 2013.
“This is clearly a good news, bad news scenario,” said Jonathan Adkins, GHSA executive director. “While we're encouraged that pedestrian fatalities haven’t increased over the past two years, progress has been slow. Protecting pedestrians is a priority for GHSA and our members; we're determined to drive the number down to zero.”
Making sustained strides in pedestrian safety has been challenging, Williams agreed.
“Pedestrian deaths declined steeply from 7,516 in 1975 to 4,735 in 2013,” Williams pointed out. “But when you consider the percentage of pedestrians killed in all motor vehicle crashes, the gains are less pronounced. The rate was 17 percent in the late 1970s and early 1980s. It fell to a low of 11 percent in the past decade, but climbed back to 14 percent in 2013.”
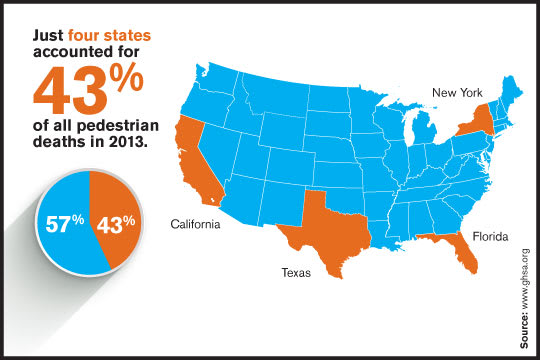
Williams noted that states with the most fatalities are primarily large-population states with large urban centers. Four states – California, Florida, Texas, and New York – accounted for 43 percent of all pedestrian deaths in 2013. Delaware and Florida had the highest rates of pedestrian deaths per 100,000 residents at 2.70 and 2.56, respectively. In the District of Columbia, pedestrians accounted for the highest percentage of all motor vehicle deaths (45 percent), followed by New York (28 percent), Nevada (25 percent) and Delaware (25 percent).

Graphic courtesy of GHSA.
The findings, however, do offer some promise. Twenty-four states and the District of Columbia had decreases in pedestrian fatalities in the first half of 2014, compared with the same period in 2013, while five remained the same. Sixteen states had nine or fewer pedestrian fatalities, with Wyoming and Nebraska each reporting just one.
Also encouraging is the substantial reduction in pedestrian fatalities involving the elderly and children. While pedestrians 70 and older have always had the highest per-capita crash rate of any age group, that number dropped from 9.3 in 1975 to 2.2 in 2013. Meanwhile, in 1975 nearly one in four pedestrian deaths (21 percent) involved infants and children up to 12 years of age; that rate fell to 4 percent in 2013.
What’s troubling is the 28-percentage-point surge in deaths involving pedestrians ages 20 to 69 over this same period. Additionally, about 70 percent of pedestrians killed in motor vehicle crashes were males, many of whom were struck at night and in the fall and winter months.
Alcohol is also a factor in many of these fatal crashes. In 2013, more than a third (36 percent) of pedestrians 16 and older involved in fatal crashes had blood alcohol concentrations of .08 or higher.
Distraction may play a role as well, since there is some evidence from Fatality Analysis Reporting System (FARS) and emergency room data that both distracted driving and walking are contributing increasingly to pedestrian injuries and fatalities.
To combat the problem, states are using a combination of engineering, education and enforcement solutions. For example, California is distributing a “how to” guide to help communities address pedestrian safety. At high-risk intersections in Pennsylvania, specially identified crossing guards are educating pedestrians of all ages about safe crossing practices. Police officers in Delaware are participating in education patrols, during which violators are stopped, educated and, in some cases, given items to increase their visibility.

Graphic courtesy of GHSA.
New York City, recognizing the impact speed has on a pedestrian's survival rate, opted to lower the city speed limit – from 30 mph to 25 mph – last November. The change is just one component of the city's “Vision Zero” plan, which also includes public outreach about safe walking and driving practices, enforcement of pedestrian safety laws and infrastructure improvements.
Engineering countermeasures such as pedestrian refuge islands, longer pedestrian signal timing and more visible crosswalks – combined with education and enforcement – are also being used in many states, including Washington and Maryland.
To read the full report, titled “Spotlight on Highway Safety: Pedestrian Traffic Fatalities by State,” click here.
Originally posted on Automotive Fleet
More Safety

Top 50 Executive Fleets
It is that time of year again! Time for the 2026 list of the Top 50 Executive Fleets, presented by Automotive Fleet and Volvo as part of its annual Fleet 500. Download now to see this year's list of companies!
Read More →
Applause & TRUCE Software Partner to Improve Driver Safety Through AI-Powered Telematics & Employee Performance Management
Applause has integrated TRUCE driving metrics directly into its employee-first performance and safety platform that transforms mobile devices into AI-powered telematics.
Read More →
How Detroit Assurance with Active Brake Assist Works
Do you want to see what it is like to experience Detroit Assurance’s Active Brake Assist? In this video, Work Truck will put you in the cab to see how it all works and then hear more details from DTNA’s Mike Young.
Read More →
Get Left of Loss: A 5-Step Workplace Prevention Framework for Fleet Operators
Violence risks do not stop at the driver’s door. Learn five practical steps fleets can take to spot threats early and protect workers before loss occurs.
Read More →
How Better Visibility Cut Speeding Violations by 48%
Fleet leaders don't need more data, they need clearer visibility into what the data is saying. This case study explores how one utility replaced speeding-event counts with a single metric — miles driven in violation — to strengthen safety and significantly reduce speeding violations.
Read More →
13 Safe Driving Tips for Commercial Vehicle Drivers
Make sure you are spending time on the road safely with these important tips.
Read More →
Recalls You Need to Know About in July 2026
If you have Altec, Ford, General Motors, Harbinger, Hyundai, Mack Trucks, or Volvo Trucks vehicles in your fleet, you should check these important recalls issued by the National Highway Safety Administration.
Read More →
How Telematics Is Transforming Fleet Risk from Insight to Action
What if you could spot risky driving before it leads to a crash? See how telematics is still changing fleet safety today.
Read More →
DOT Rules Remain Firmly Lit on Marijuana
DOT says not so fast on marijuana. Even with federal reclassification efforts, commercial drivers in safety-sensitive roles remain subject to marijuana testing and prohibitions.
Read More →
Lytx Adds Fleet Management Enhancements to LytxOne Platform
Lytx has added new features to LytxOne to bring safety, operational insight, asset visibility, and compliance into a unified, all-in-one platform.
Read More →