



Global Traffic Trends Revealed, Indianapolis Sees Improved Travel Times
Despite the general decline in average speeds in most cities after the pandemic, Indianapolis witnessed improved travel times. In contrast, cities like London and Dublin saw a significant increase in travel time over the year.

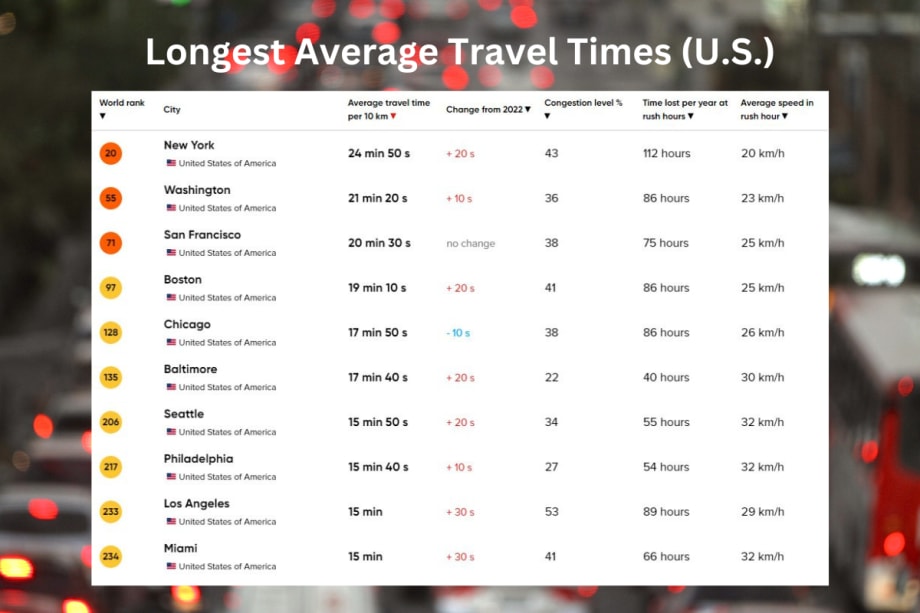
Digging into U.S. regions that TomTom studied, take a look at the top 10 U.S. cities with the longest commute times.
Photo: TomTom | Work Truck
The geolocation technology specialist TomTom released the 13th edition of its TomTom Traffic Index, an annual report providing data and information on traffic trends in 387 cities in 55 countries throughout 2023.
The TomTom Traffic Index is based on data from over 600 million in-car navigation systems and smartphones. For each city (both the city center and the wider metropolitan area), TomTom calculates the average travel time it took to cover the millions of miles driven across the entire network in 2023.
However, with traffic being something most drivers accept as part of their daily lives, even small changes in traffic trends can significantly impact a vehicle fleet.
“Increasing delays in urban areas mean engines run idle and extra consumption is needed for the acceleration during congestion, or from traffic signal to traffic signal. For fleet operators, this means an increasing operational cost. This also means that it becomes even more important to use accurate, real-time data to plan and route fleets over less congested routes,” said Jeroen Brouwer, director of customer program management at TomTom.
Digging into TomTom’s 2023 Traffic Data
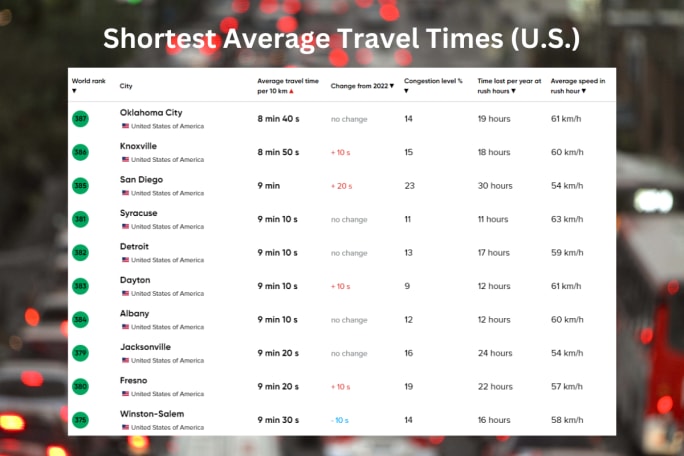
Digging into U.S. regions that TomTom studied, take a look at the top 10 U.S. cities with the shortest commute times.
Photo: TomTom | Work Truck
The trend over 2023 confirms a general decline in average speeds in most cities after the pandemic.
“Of the 387 cities analyzed in this year’s Traffic Index, 228 cities (almost 60%) saw their average travel time increase, while 77 (~20%) had a higher average speed (and therefore shorter journey times) than the previous year. The last 20% of cities have seen no difference compared to 2022. The largest increases in travel times were in Dublin (Ireland), London (UK), Mexico City (Mexico), and Lima (Peru). The few cities that saw an improvement in travel times were Indianapolis (U.S.), Cairo (Egypt), and Frankfurt am Main (Germany),” Brouwer said.
In London and Dublin, the two cities with the lowest average speed, travel times for a 6-mile journey increased by +1 minute compared to 2022 - only seven cities in the world have reached a 1 minute or higher raise in average travel time for a 6-mile trip.
“Travel time is the result of multiple factors, which can be grouped into static factors such as road network configuration, road sizes and capacities, underperforming traffic signals or speed limits, and dynamic factors like traffic congestion, roadworks, bad weather, etc., providing changes in traffic flow. For example, London was the slowest city in the world in 2023,” Brouwer noted.
The capital of England has the lowest base speed due to static factors, according to TomTom, such as the absence of any fast roads and speed limits changing to 20 mph on most roads over the past years.
“So, even in optimal traffic conditions, the average speed in London is slower than any other city worldwide. However, London’s road infrastructure is not the only reason travel times are slower than in any other city – London is also where drivers have lost the most time due to traffic congestion,” Brouwer said.
The increase in both the cost of petrol and fuel consumption, due to longer journey times, clearly impacts the budget of motorists who have to use their car every day to get to work. In more than 60% of 351 cities where TomTom aggregates fuel prices, the average fuel budget increased by 15% between 2021 and 2023. This increase in consumption naturally directly impacts average CO2 emissions per vehicle.
Traffic Congestion Around the World
“With more than half of the world’s population living in urban areas, traffic congestion and its economic, ecological, and health consequences have become a problem that needs to be urgently addressed,” said Ralf-Peter Schäfer, Vice President of Traffic at TomTom.
“Planning the future of urban areas is essential to ongoing traffic management. Large urban areas harness Big Data to plan infrastructure and development that will alleviate traffic congestion. Analysis of historical traffic data can help growing cities map more efficient road systems and plan better zoning using location intelligence. Effective implementation of planning measures such as implementing LEZs to reduce air pollution will benefit from data from connected cars.”
As more cities ban gasoline and diesel engine cars from specific roads and areas, fleet owners are pushed to purchase hybrid or full-electric vehicles.
“This is a good move, and with the growing charging network, it becomes easier to ‘fuel up’ the truck or van. However, it is important to note that an EV stuck in traffic uses a lot of energy. So even for those using EVs, we recommend planning routes smartly with the right data available to avoid wasting energy,” Brouwer said.
Reducing Traffic Congestion Concerns
Brouwer reminded fleet managers that every city is unique and needs its own actions.
“However, actions that have proven successful are, for example, the reconfiguration of traffic signals and the creation of new lanes and roads to resolve bottlenecks. It is also a behavioral item, and with better planning of trips, a road user or truck driver can save a lot of trouble,” Brouwer said. “Better air quality is also driven with a more electrified fleet. However, remember that an electric car or truck stuck in a traffic jam is using a lot of energy to stay heated and get moving again.”
To help combat traffic congestion, plan your trip.
“Routing engines are smarter than you might think, and planned closures and delays are already considered, even if you plan the trip for a truck next week. This will help fleet managers avoid frustration and surprises. Along with the planning, be agile to the traffic situation and try to build flexibility in the order of your destinations, avoiding congestion as much as possible. In a city like Dublin, the delays in rush hour are so heavy that a fleet manager planning trips for such a region should think twice before planning deliveries during rush hour,” Brouwer said.
Over time, the TomTom Traffic Index has become a comprehensive tool for urban planners, policymakers, and drivers, as it helps to understand and manage traffic congestion and provides insights into the impact of congestion on a city’s transportation infrastructure and economy.
Real-time traffic data can feed the algorithms municipalities use to manage traffic jams by optimizing road logistics and routes. According to a McKinsey study, this can reduce city commuting times by 15-20%. Data can be used to prevent traffic jams through intelligent traffic light synchronization, variable speed limits, and real-time alerts showing drivers the fastest routes.
More Safety
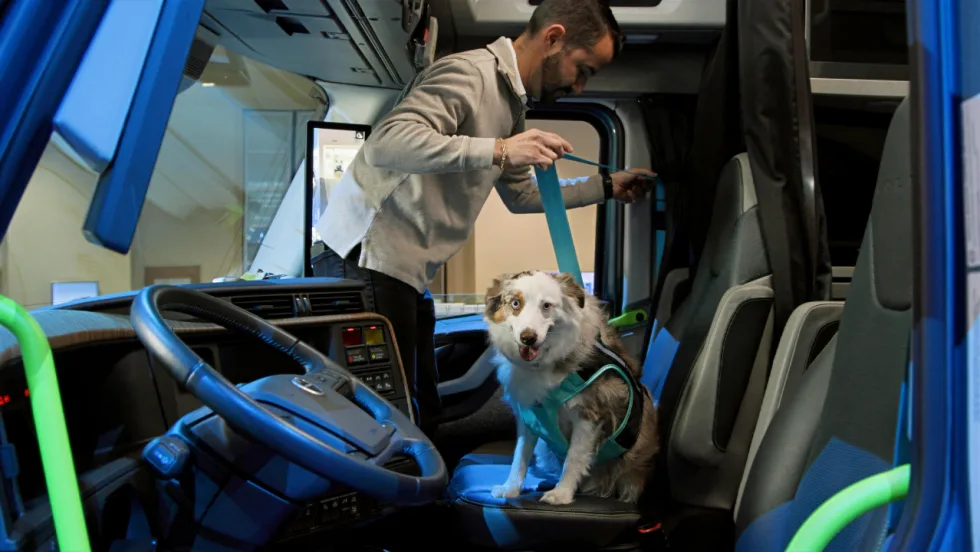
Volvo Trucks Releases New Safety Recommendations for Traveling with Pets
One of the most important recommendations for professional drivers traveling with pets is to ensure pets are properly restrained while the truck is moving. Other tips are available in the new guide from Volvo Trucks North America and Center for Pet Safety.
Read More →
API Issues Refueling Safety Guidelines
The American Petroleum Institute offers a list of safe vehicle refueling guidelines, including ways to avoid potential problems with static electricity discharges in fall, winter, and early spring.
Read More →
Winter Fleet Prep: Expert Tips to Keep Vehicles Running Smoothly
Cold weather can expose weak batteries, tires, fuel systems, and maintenance gaps fast. Use this winter fleet checklist to prepare trucks and drivers before temperatures drop.
Read More →
When a Work Truck Breaks Down, the Job Can Stop, Too
A work truck breakdown can stop more than the vehicle. Discover how payloads, jobsites, and specialty equipment change the roadside response.
Read More →
What Stronger Long-Term Fleet Service Partnerships Actually Require
Fleet service partnerships rarely fall apart all at once. Learn the three warning signs that trust is eroding and what fleets and providers can do before downtime, frustration, and lost revenue follow.
Read More →
Applause & TRUCE Software Partner to Improve Driver Safety Through AI-Powered Telematics & Employee Performance Management
Applause has integrated TRUCE driving metrics directly into its employee-first performance and safety platform that transforms mobile devices into AI-powered telematics.
Read More →
How Detroit Assurance with Active Brake Assist Works
Do you want to see what it is like to experience Detroit Assurance’s Active Brake Assist? In this video, Work Truck will put you in the cab to see how it all works and then hear more details from DTNA’s Mike Young.
Read More →
Get Left of Loss: A 5-Step Workplace Violence Prevention Framework for Fleet Operators
Violence risks do not stop at the driver’s door. Learn five practical steps fleets can take to spot threats early and protect workers before loss occurs.
Read More →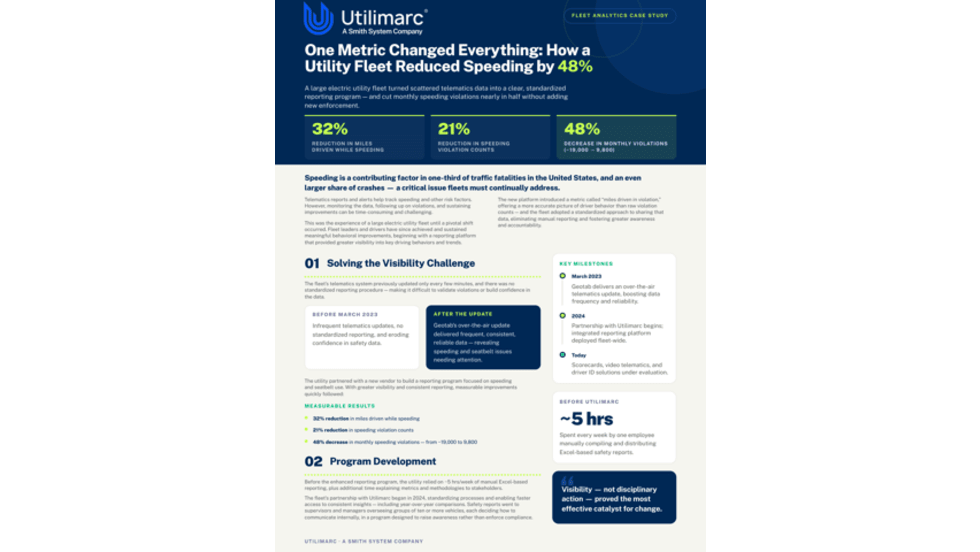
How Better Visibility Cut Speeding Violations by 48%
Fleet leaders don't need more data, they need clearer visibility into what the data is saying. This case study explores how one utility replaced speeding-event counts with a single metric — miles driven in violation — to strengthen safety and significantly reduce speeding violations.
Read More →
13 Safe Driving Tips for Commercial Vehicle Drivers
Make sure you are spending time on the road safely with these important tips.
Read More →