


Related: ARI Launches Fleet Monitoring Tool
ARI Offers Accident Data Feed
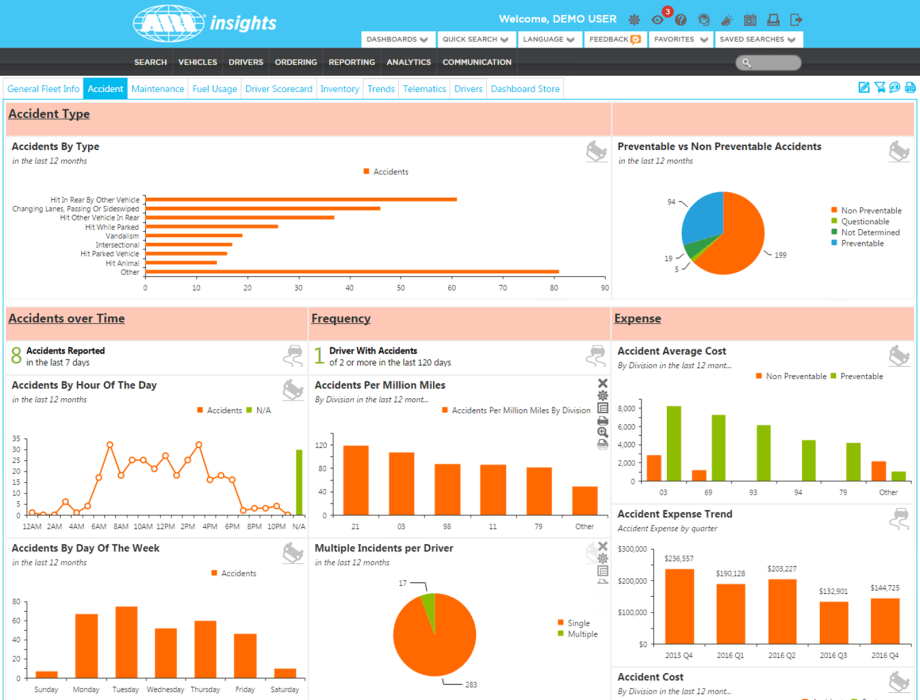
ARI has added the Accident Dashboard to its insights portal that allows fleet managers to see the cost of accidents, as well as identifying trends and patterns.
March 29, 2017
Screenshot of Accident Dashboard courtesy of ARI.
2 min to read
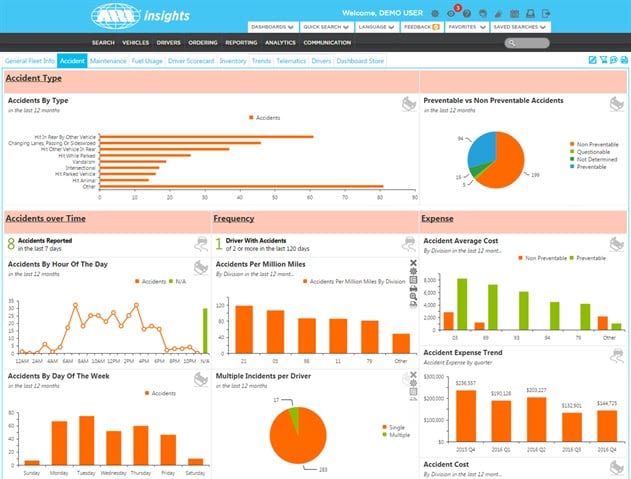
Screenshot of Accident Dashboard courtesy of ARI.
ARI has added an Accident Dashboard to its ARI insights portal that's designed to allow fleet managers to see the impact accidents have had on a company’s bottom line and identify trends and patterns that might suggest additional training is needed or other changes should be made in order to prevent accidents, the fleet management company announced.
The dashboard, available to ARI clients in the U.S. and Canada who use the ARI Accident Management program, provides details about a fleet's accident-related data with charts and graphs.
Fleet managers can study accidents by day of the week and time of day over a 12-month period, which can help fleet managers identify at-risk time periods. Fleet managers can also identify drivers with multiple incidents and the average cost per incident. The dashboard offers 14 metrics related to accident claim information.
"The ARI Accident Dashboard can adapt to whatever kind of fleet you may be dealing with, whether it is a car or light-, medium-, heavy-duty, or mixed," said Tony Candeloro, vice president for product development and client information systems for ARI. "The filters allow users to dig into the data in a variety of ways, including time of day, cost, whether the accident was determined to be preventable or not, and the type of accident (e.g., hit stationary object, hit animal, hit parked vehicle). This helps users spot trends and take action to prevent future issues. You can also filter the data by asset type or compare across different asset types. So, for example, you can choose to look at data via a specific filter – accident type, for example – and compare between the medium- and heavy-duty trucks within your fleet.”
The Accident Dashboard also gives fleet managers the ability to fairly compare accident rates among different divisions, since it can determine the number of claims per million miles driven. Previously, fleet managers were only able to compare divisions by the number of accidents that had occurred without taking into account how much each had travelled.
Accident Dashboard also tracks the costs associated with each accident, so fleet managers can identify the average and total cost of preventable and non-preventable accidents by division and can plot that information to see the trend over the past five quarters.
Originally posted on Automotive Fleet
More Safety

Sponsored•August 1, 2026
Top 50 Executive Fleets
It is that time of year again! Time for the 2026 list of the Top 50 Executive Fleets, presented by Automotive Fleet and Volvo as part of its annual Fleet 500. Download now to see this year's list of companies!
Read More →
Applause & TRUCE Software Partner to Improve Driver Safety Through AI-Powered Telematics & Employee Performance Management
Applause has integrated TRUCE driving metrics directly into its employee-first performance and safety platform that transforms mobile devices into AI-powered telematics.
Read More →
How Detroit Assurance with Active Brake Assist Works
Do you want to see what it is like to experience Detroit Assurance’s Active Brake Assist? In this video, Work Truck will put you in the cab to see how it all works and then hear more details from DTNA’s Mike Young.
Read More →
Get Left of Loss: A 5-Step Workplace Prevention Framework for Fleet Operators
Violence risks do not stop at the driver’s door. Learn five practical steps fleets can take to spot threats early and protect workers before loss occurs.
Read More →
Sponsored•July 17, 2026
How Better Visibility Cut Speeding Violations by 48%
Fleet leaders don't need more data, they need clearer visibility into what the data is saying. This case study explores how one utility replaced speeding-event counts with a single metric — miles driven in violation — to strengthen safety and significantly reduce speeding violations.
Read More →
13 Safe Driving Tips for Commercial Vehicle Drivers
Make sure you are spending time on the road safely with these important tips.
Read More →
Recalls You Need to Know About in July 2026
If you have Altec, Ford, General Motors, Harbinger, Hyundai, Mack Trucks, or Volvo Trucks vehicles in your fleet, you should check these important recalls issued by the National Highway Safety Administration.
Read More →
How Telematics Is Transforming Fleet Risk from Insight to Action
What if you could spot risky driving before it leads to a crash? See how telematics is still changing fleet safety today.
Read More →
DOT Rules Remain Firmly Lit on Marijuana
DOT says not so fast on marijuana. Even with federal reclassification efforts, commercial drivers in safety-sensitive roles remain subject to marijuana testing and prohibitions.
Read More →
Lytx Adds Fleet Management Enhancements to LytxOne Platform
Lytx has added new features to LytxOne to bring safety, operational insight, asset visibility, and compliance into a unified, all-in-one platform.
Read More →