

Hail Damage Claims for Vehicles Spiking
Insurers made increasingly higher payouts for hail damage to vehicles in three of the four years ending with 2014 than in the earlier three years of a seven-year study completed by the Highway Loss Data Institute.
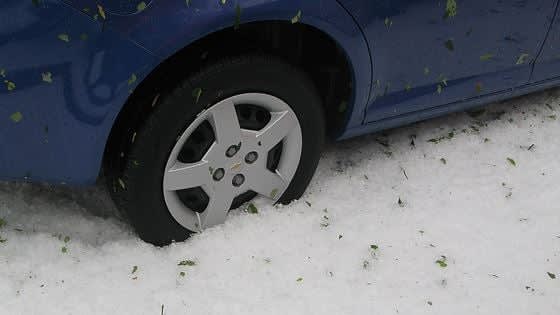
Photo courtesy of HLDI.
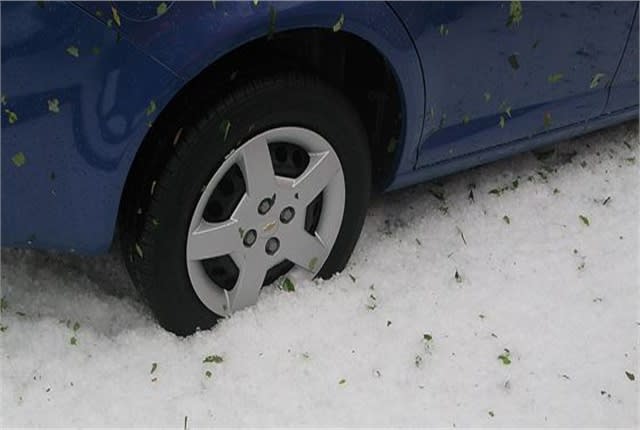
Photo courtesy of HLDI.
Insurers made increasingly higher payouts for hail damage to vehicles in three of the four years ending with 2014 than in the earlier three years of a seven-year study completed by the Highway Loss Data Institute.
Members of the institute's database paid $5.37 billion for hail-related claims between 2008 and 2014, the insurance industry organization announced.
The biggest payouts were in 2014 ($968.9 million) and 2011 ($948.3 million), HLDI reported. But the actual payout by all insurers is likely higher and estimated to be $7.26 billion, including $1.33 billion in 2014 and $1.28 billion in 2011. This estimated total takes into account that not all companies are represented in HLDI's database, and not all data suppliers submit weather information, HLDI said.
The hail claims data are from the 31 companies that specify weather as a cause of loss when supplying information to HLDI. These companies’ exposure represents 87% of the comprehensive coverage exposure in HLDI’s database. Results for the latest analysis were based on more than 491 million insured vehicle years and more than 1.5 million claims. Losses were concentrated in the country’s midsection.
HLDI has been studying the frequency, severity, and cost of these claims for several years. Using information from insurers about weather-related losses under comprehensive coverage, HLDI analysts matched the dates of those claims to hail events recorded by the National Oceanic and Atmospheric Administration to determine which vehicle claims were for hail damage.
The analysis excluded any hailstorms that accompanied tornadoes since it isn't possible using HLDI’s data to determine which weather event caused the damage that led to the claim. Motorcycle claims also were excluded.
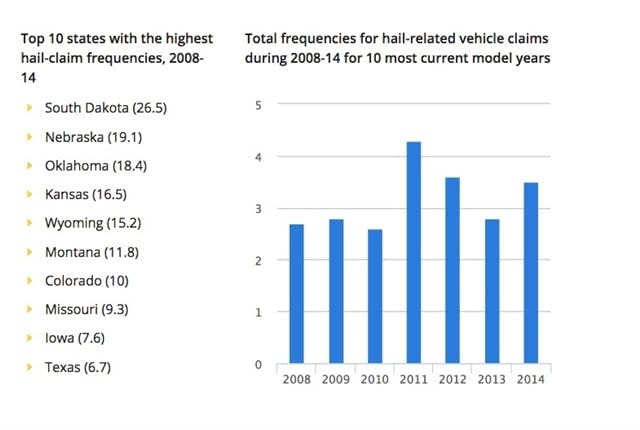
Source: HLDI
The results showed a frequency of 3.2 claims per 1,000 insured vehicle years during 2008-2014, a claim severity of $3,428, and overall losses of $11 per insured vehicle year. Across the study period, 2011 had the highest claim frequency of 4.3, while 2014 had the highest claim severity at $4,169 and overall loss at $15 per insured vehicle year.
The states with the highest claim frequencies during 2008-2014 were South Dakota (26.5), Nebraska (19.1), Oklahoma (18.4) and Kansas (16.5). Other states in the top 10, by order, were Wyoming (15.2), Montana (11.8), Colorado (10), Missouri (9.3), Iowa (7.6), and Texas (6.7).
“HLDI periodically does studies to document the effects of weather on insurance losses,” said Matt Moore, HLDI vice president. “Hail storms can be devastating events for vehicle owners. Given the recent news from Texas, as soon as the final numbers are available, we will be updating this study.”
So far in 2016, severe thunderstorms have pummeled Texas, Kansas, Missouri, and Oklahoma with large hailstones. Vehicle damage estimates for three springtime Texas storms alone top $1 billion, according to the Insurance Council of Texas. Some of these losses may be due to other weather factors, such as high winds.
“2011 and 2014 were bad years for hail storms, but it looks like 2016 may be worse,” Moore said.
Although Great Plains and Midwestern states predominate HLDI’s hail claims’ list, the most extreme hail events often occur in other regions. This was the case in five of the seven years examined. While it’s true that spring is prime time for destructive hail events, HLDI analysts uncovered another outlier.
During the study period, the worst hail storm measured by vehicle insurance losses occurred in the fall in the Southwest. Vehicle damage from the Oct. 5, 2010, Arizona storm was concentrated in three counties: Gila, Maricopa, and Yavapai. Of the three counties, Maricopa had the highest hail-loss tally for the day, with nearly 39,000 claims and more than $157 million in payments, according to HLDI.
Originally posted on Automotive Fleet
More Safety

Top 50 Executive Fleets
It is that time of year again! Time for the 2026 list of the Top 50 Executive Fleets, presented by Automotive Fleet and Volvo as part of its annual Fleet 500. Download now to see this year's list of companies!
Read More →
Applause & TRUCE Software Partner to Improve Driver Safety Through AI-Powered Telematics & Employee Performance Management
Applause has integrated TRUCE driving metrics directly into its employee-first performance and safety platform that transforms mobile devices into AI-powered telematics.
Read More →
How Detroit Assurance with Active Brake Assist Works
Do you want to see what it is like to experience Detroit Assurance’s Active Brake Assist? In this video, Work Truck will put you in the cab to see how it all works and then hear more details from DTNA’s Mike Young.
Read More →
Get Left of Loss: A 5-Step Workplace Prevention Framework for Fleet Operators
Violence risks do not stop at the driver’s door. Learn five practical steps fleets can take to spot threats early and protect workers before loss occurs.
Read More →
How Better Visibility Cut Speeding Violations by 48%
Fleet leaders don't need more data, they need clearer visibility into what the data is saying. This case study explores how one utility replaced speeding-event counts with a single metric — miles driven in violation — to strengthen safety and significantly reduce speeding violations.
Read More →
13 Safe Driving Tips for Commercial Vehicle Drivers
Make sure you are spending time on the road safely with these important tips.
Read More →
Recalls You Need to Know About in July 2026
If you have Altec, Ford, General Motors, Harbinger, Hyundai, Mack Trucks, or Volvo Trucks vehicles in your fleet, you should check these important recalls issued by the National Highway Safety Administration.
Read More →
How Telematics Is Transforming Fleet Risk from Insight to Action
What if you could spot risky driving before it leads to a crash? See how telematics is still changing fleet safety today.
Read More →
DOT Rules Remain Firmly Lit on Marijuana
DOT says not so fast on marijuana. Even with federal reclassification efforts, commercial drivers in safety-sensitive roles remain subject to marijuana testing and prohibitions.
Read More →
Lytx Adds Fleet Management Enhancements to LytxOne Platform
Lytx has added new features to LytxOne to bring safety, operational insight, asset visibility, and compliance into a unified, all-in-one platform.
Read More →