

Making the Most of Digital Work Orders
Work orders can do more than track service—they can reveal shop inefficiencies, optimize PM schedules, and reduce downtime. Learn how to collect and use the right data.

Labeling work orders by delay type, asset class, or repair priority gives fleet managers the data needed to pinpoint and fix workflow issues.
Photo: Work Truck
When it comes to managing the health of the fleet, work orders are one of the best tools for the job, providing a look into everything from shop productivity and bottlenecks to parts inventory, asset status and, of course, cost. But work orders can be somewhat of an unsung hero.
Really understanding what work order data to collect, as well as its role in fleet reporting, can give you better insights into service workflow inefficiencies while shining a light on where — and how — to improve those workflows, including preventive maintenance (PM) programs and scheduling, asset replacement schedules, optimal inventory counts, and more.
Collecting the Necessary Data (and Then Some)
The benefits you can gain from collecting work order data varies depending on what information you collect — provided that information is reliable and you’re collecting it consistently.
Most work orders have your basic line items but there are a few additional items and pertinent data points you can add to work orders to ensure you’re getting all the data you need to surface and source costly issues, whether mechanical or procedural. These include (but are not limited to):
Estimated versus actual service duration
Repair priority class
Labels
Using Work Order Data for Decision-making
Collecting data is only half the battle. How you use that data, though… well that can make a world of difference. Let’s break down a few ways to analyze collected work order data to surface areas for improvement.
Estimated versus Actual Service Duration
One of the best ways to gauge shop productivity, technician productivity and competency, and workflow bottlenecks is by comparing estimated versus actual service duration. You can look at service duration in one of two ways: the amount of time an asset spends in the shop from drop off to pick up, or the amount of time a service task actually takes.
When calculating the former, it’s important to take into account that operators may not be dropping an asset off at the scheduled time or there could be a delay in asset retrieval once service is performed. This broader approach can highlight issues like communication bottlenecks between the shop and operators that are causing unnecessary downtime or productivity delays.
On the other hand, tracking active service times can highlight how much time a technician is spending on a service task. This may be harder to do when tracking service manually or using maintenance spreadsheets, but if you’re using a digital fleet solution, the task becomes significantly easier.
Fleet solutions provide digital work orders technicians can access from a computer, tablet, or mobile device and allow technicians to clock in and out of work orders as they go. Plus, you can add estimated service durations to quickly compare the estimated versus actual service times, which helps surface workflow issues — like understaffing or scheduling issues — and technician proficiency so you can assign work orders based on technician skill and availability.
Repair Priority Class
Tracking repair priority class on work orders allows you to determine where the brunt of the service spend is going. You can categorize services as scheduled, non-scheduled, or emergency, then on a monthly or quarterly basis, assess which category is seeing the highest numbers, both in cost and frequency.
If PM — typically categorized as scheduled service — makes up the lowest percentage of service spend, it may be time to reevaluate and strengthen your fleet’s PM practices. If you’re noticing a high volume of non-scheduled or emergency services, you may want to check the fleet's PM and inspection rate compliance or even driver behavior patterns.
Repair priority class can also provide some context into lengthy service durations and provide insights into how — and how much — unscheduled service affects shop workflows, and what costs are associated with the extended downtime and productivity loss.
Labels in Work Orders
Using labels in your work orders allows you to further organize service based on criteria of your choosing. You can use labels to break down service by asset type, acquisition year, and/or by location for fleets with multiple shop locations.
You can also use labels to establish reasons for service delays — such as waiting on parts or waiting on technician availability — and you can stack labels for more pointed insights. So, for example, let’s say a technician has two open work orders, one with a scheduled priority class and one with an emergency priority class. You have the tech jump on the priority task and return to the scheduled service once finished, but this causes a delay in the scheduled service duration.
You can add a label to the scheduled service work order, something like delay due to a critical issue. Now when you pull your service reports, you can see not only how much downtime was caused by the asset needing the emergency repair, but also the downtime it caused on the scheduled side.
Speaking of reporting, when using labels, consistency is important, as this allows you to filter the service reports you need based on the label used. Basically, don’t use waiting on a part and waiting for a part, rather choose one and stick with it so that any time you want to see downtime related to parts delays, for example, all work orders with that label will be displayed.

Digital work orders help fleet teams track service progress, compare estimated and actual task times, and reduce costly downtime.
Photo: Work Truck
Automate Data Collection and Reporting
Using digital work orders in a fleet optimization platform makes collecting and analyzing work order data a lot more manageable and provides better insights into shop processes. Plus, it automates data collection for better consistency and more uniform reporting.
In addition to the data points mentioned above, digital work orders also track work order statuses in real time — that is, whether a work order is open, pending, completed, needs approval, or approved. This data point can help you better manage workloads and determine where inefficiencies lie.
If you have a pending work order, for instance, and it has the label waiting on parts, there could be an issue around in-house parts stocking, whereas if the work order has a waiting on open technician label, then the issue could be improper staffing or scheduling.
Service reports in a digital fleet solution are automatically generated based on work order data and, because reports are filterable, you can quickly see how many assets spent unnecessary downtime in the shop and why. While work orders are a standard in fleet, the data you can gain from them goes well beyond cost.
More Maintenance

Proven Ways to Reduce Work Truck Downtime
The age-old problem of downtime will always be a reality, but with new strategies at hand, fleets have more ways to keep trucks on the road longer.
Read More →
Continental Tire Partners with Atrium Solutions for Emergency Road Service
Continental Tire is turning to digital platforms that are transforming the way service events are managed. It has partnered with Atrium Solutions on its new digital Emergency Road Service (ERS) platform solution.
Read More →
Mack Trucks Expands Premium Service Contract Coverage to Mack MD Series
Mack Premium Service Contract coverage is now available for the Mack MD Series, and Mack Trucks said it takes the guesswork out of maintenance and helps owners control costs.
Read More →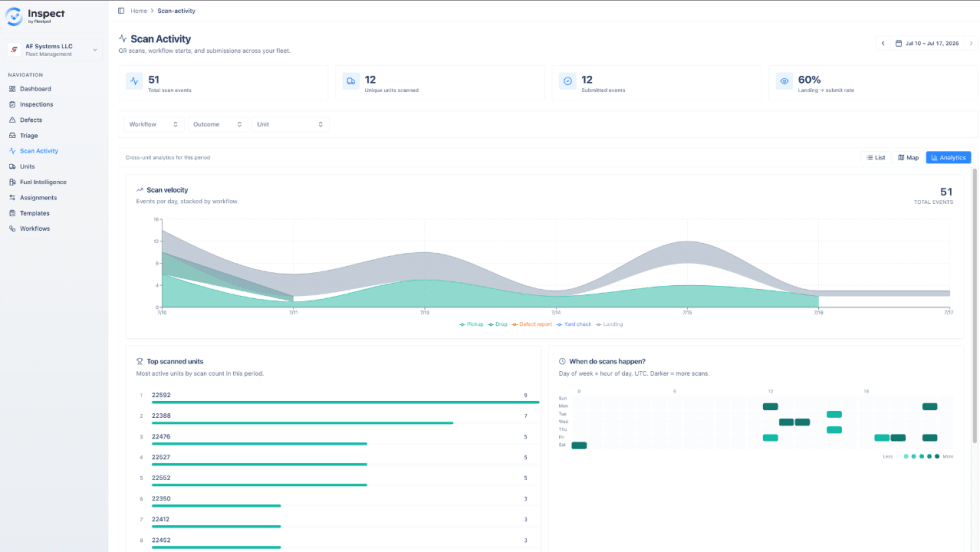
Fleetpal Makes Its Driver Inspection App Free for Qualified Fleets
Fleetpal Inspect's new free tier provides fleets with 30 or more power units with electronic DVIRs, at no cost, in accordance with FMCSA's rule explicitly authorizing electronic driver vehicle inspection reports.
Read More →
Ford Joins BlackRock, Google, and Carhartt to Establish Alliance for America’s Skilled Trades
The Ford Motor Company, BlackRock, Google, and Carhartt have established the Alliance for America’s Skilled Trades. The founding partners are all companies that have already shown leadership on the issue.
Read More →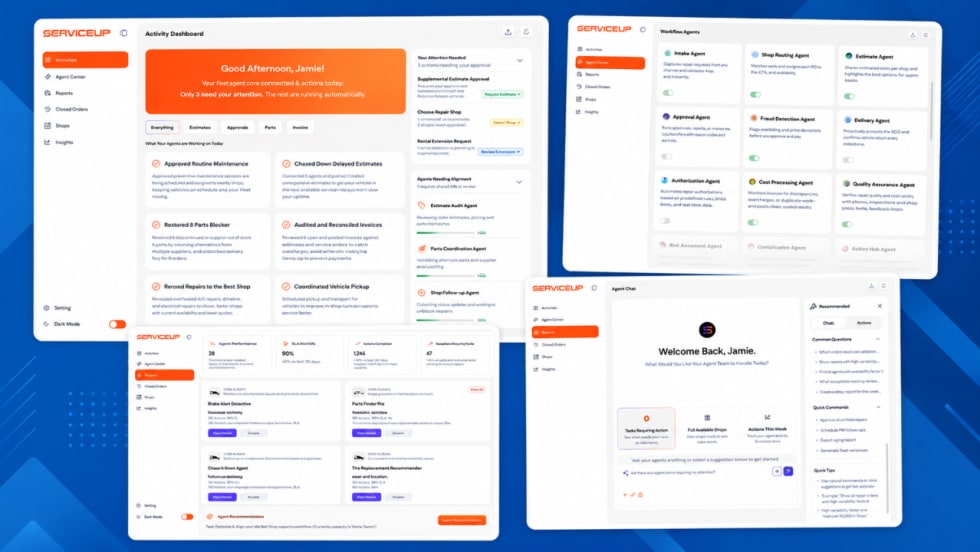
ServiceUp Adds AI Repair Agents to Automate Fleet Maintenance Workflows
ServiceUp says its new platform can route vehicles, review estimates, monitor repairs, and validate invoices across Class 1 through Class 8 fleets.
Read More →
APEX by BendPak AL9LC Two-Post Lift Maximizes Overhead Clearance
BendPak's new APEX AL9LC two-post floorplate car lift maximizes overhead clearance by eliminating the top crossbar found on many two-post lifts, making it a good choice for low-ceiling bays.
Read More →
ASE Education Foundation Receives $25 Million Federal Grant to Put a New Generation of Service Technicians to Work
The U.S. Department of Labor awarded a $25-million grant to the ASE Education Foundation to fund a four-year program to help employers hire and retain new auto, collision, and truck technicians.
Read More →
Mack Trucks Adds Lock & Leave OTA Software Updates
Mack Trucks’ new Over-the-Air (OTA) enhancement lets remote software updates complete unattended; simply start the update, lock the truck, and walk away. That means a driver or technician does not have to wait with the truck while the updates take place.
Read More →
Isuzu Launches Veterans Apprenticeship Program to Strengthen Technician Workforce
Isuzu Commercial Truck of America has launched the Isuzu Veterans Apprenticeship Program to offer a pathway for military veterans to become trained as technicians for Isuzu dealerships.
Read More →