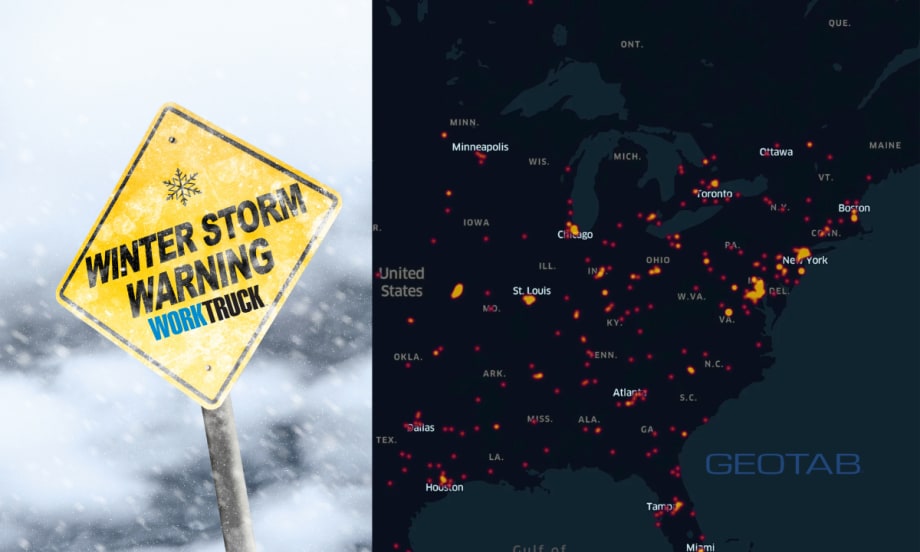
Geotab’s real-time connected vehicle data shows a 53% spike in U.S. collisions as Winter Storm Fern brings widespread snow and ice across major fleet corridors.
Credit: Work Truck | Geotab
4 min to read
Editor's Note: This story was updated to include additional expert insight from Geotab’s Vice President of Data & Analytics, Mike Branch, on what’s driving the collision spike and what fleets can do next.
Ad Loading...
New real-time data from Geotab is highlighting a sharp increase in roadway risk as Winter Storm Fern continues to impact travel across a wide swath of the U.S.
Ad Loading...
The Weather Channel reported that Fern’s impacts have expanded from the South into the Northeast, with heavy snow and significant ice, hundreds of thousands experiencing power outages, and many roads and highways in affected areas are reported as impassable.
Against that backdrop, Geotab’s connected vehicle data shows collisions jumped 53% nationwide starting Friday at 7 p.m., compared to the average of the previous two weekends.
Here’s the quick snapshot:
National surge: +53% in collisions overall
Regional hotspots: Maryland (sharpest increase), followed by Kentucky and Indiana
What's Driving the Spike in Collisions, Truly?
While post-storm cleanup can create its own hazards, Geotab says this surge is being driven most directly by the storm itself and the rapid deterioration of road conditions.
Ad Loading...
“The data shows this 53% surge was driven primarily by states like Maryland, where we saw a dangerous combination of ice and snow,” said Mike Branch, Geotab’s vice president of data and analytics. “Based on our insights, this spike we're seeing is tied very closely to the storm conditions and is a clear signal of how deteriorating road conditions can compromise safe driving.”
The 24 to 48 Hours After a Disaster Matter Most
For fleets still operating in impacted regions, Branch emphasized that the most critical period often comes right after the worst conditions hit.
“For fleet managers in Maryland, Kentucky, or Indiana, the 24 to 48 hours after the weather event are most critical,” he said.
In that window, Branch’s top recommendations focus on fundamentals that get even more important when roads are slick and traffic becomes unpredictable. His top tips are:
Create a safety buffer: Remind drivers to double-check their following distance.
"Tailgating is a primary factor in collisions, and winter conditions like ice on the roads make it worse. Giving themselves more space will help drivers avoid harsh braking events that often lead to a slide or rear-end crash,” he said.
Focus on the road: Distracted driving is dangerous at any time, but it significantly exacerbates the risk during a storm.
"Even a momentary distraction can mean missing a patch of ice or a sudden change in traffic. Keeping eyes on the road is the best defense against unpredictable conditions,” he said.
Use data to find the safest routes: Don’t just look at the accidents that happened, look at the near-misses in your data, like harsh braking events from the last 12 hours.
"These are leading indicators of where your drivers are struggling. If roads look risky, find alternative routes. In these conditions, the best route is the safest route," Branch added.
Ad Loading...
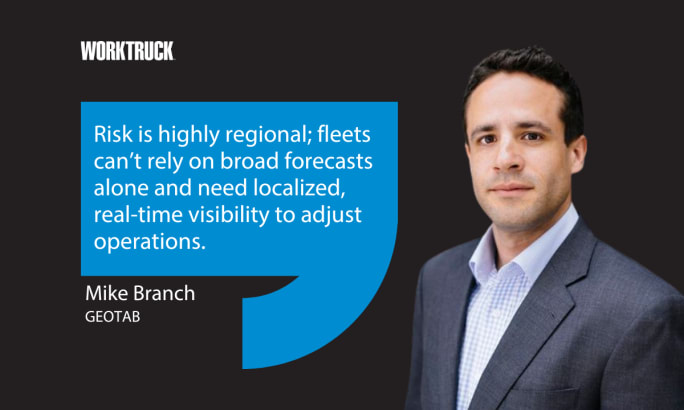
Geotab Vice President of Data & Analytics Mike Branch says winter storm risk is highly regional, with connected vehicle data helping fleets spot dangerous conditions in real time and adjust operations faster
Credit: Work Truck | Geotab
Why Maryland, Kentucky, and Indiana Jumped in Collisions
Geotab’s data also reinforces how quickly risk concentrates in specific regions, especially when snow and ice move through areas with heavy commuter and freight activity.
“The regional hotspots show how quickly localized weather events can translate into elevated collision risk for fleets,” Branch said. “Areas like Maryland and parts of the Mid-Atlantic and Midwest are major freight and commuter corridors, so when winter weather hits, even brief periods of snow or ice can have an outsized impact.”
He added that these spikes are a reminder that “risk is highly regional; fleets can’t rely on broad forecasts alone and need localized, real-time visibility to adjust operations.”
How Does Connected Vehicle Data Speed Up Decisions?
That localized visibility can also change how fast fleets respond. According to Branch, “Near real-time connected vehicle intelligence can signal a danger zone in minutes.”
“For example, when we see a cluster of vehicles triggering anti-lock braking (ABS) or traction control events at a specific interchange, that is a digital ‘flare’ in the data,” he said.
Ad Loading...
That kind of signal can help fleets act before incidents escalate or drivers start calling in after a slide-off.
“An example of a faster decision? A fleet manager can see these ‘micro-climates’ of risk and push a geofenced alert to every driver entering that zip code, or even halt operations for a specific two-hour window until salt trucks arrive,” Branch said. “Instead of waiting for a driver to call in a slide-off, the manager is acting on the data that tells them road conditions are not safe.”
For fleets still operating in impacted regions, the spike is a timely reminder that storm response is not just about what’s in the forecast. It’s about what’s happening on the roads right now as conditions shift, visibility drops, and ice builds.
It is that time of year again! Time for the 2026 list of the Top 50 Executive Fleets, presented by Automotive Fleet and Volvo as part of its annual Fleet 500. Download now to see this year's list of companies!
Applause has integrated TRUCE driving metrics directly into its employee-first performance and safety platform that transforms mobile devices into AI-powered telematics.
Do you want to see what it is like to experience Detroit Assurance’s Active Brake Assist? In this video, Work Truck will put you in the cab to see how it all works and then hear more details from DTNA’s Mike Young.
Violence risks do not stop at the driver’s door. Learn five practical steps fleets can take to spot threats early and protect workers before loss occurs.
Fleet leaders don't need more data, they need clearer visibility into what the data is saying. This case study explores how one utility replaced speeding-event counts with a single metric — miles driven in violation — to strengthen safety and significantly reduce speeding violations.
If you have Altec, Ford, General Motors, Harbinger, Hyundai, Mack Trucks, or Volvo Trucks vehicles in your fleet, you should check these important recalls issued by the National Highway Safety Administration.
DOT says not so fast on marijuana. Even with federal reclassification efforts, commercial drivers in safety-sensitive roles remain subject to marijuana testing and prohibitions.