

How to Calculate Optimal Replacement Cycles
A variety of approaches can be used, each with their own advantages and disadvantages that must be considered.

Data from an economic lifecycle analysis can be viewed as a chart to assist fleet managers in determining the best time to replcae a vehicle. Source: Chatham Consulting
Medium-duty trucks encompass a broad spectrum of fleet applications: They can include some pickups, delivery trucks, ambulances, and even small buses.
There are many different techniques that can be used to calculate replacement cycles for medium-duty trucks, with advantages and disadvantages associated with each. There also can be non-economic factors involved that may influence or even dictate replacement cycles. Examples include meeting air quality standards to reduce tailpipe emissions or disposing school buses before they reach the retirement age mandated by school boards.
For the purpose of this article, a medium-duty truck has a GVWR from 10,001 pounds to 19,500 pounds. This equates to U.S. Department of Transportation (DOT) Vehicle Inventory and Use Survey (VIUS) Class 3 (10,001-14,000 pounds), Class 4 (14,001-16,000 pounds), and Class 5 (16,001-19,500 pounds).
Establishing replacement cycles for medium-duty trucks is both an art and science. It involves judgment, prediction, forecasts, and assumptions on one hand, and analysis of available data on the other. When financial resources are limited, the effort will focus more on prioritizing which one of many vehicle candidates should be replaced.
However, for organizations that lease their fleet units, the cycle decision has already been made — it is the term of the lease. Ideally, the lease term is set at the expected economic life of the vehicle. Leasing analysis is a financial and fleet management issue requiring joint expertise from finance, fleet management, and the leasing company.
The Fundamental Questions
Before replacing a unit, a few fundamental questions must be asked.
Is the vehicle being fully used?
Does it have the proper specification?
If a vehicle is not being fully used, why replace it at all? Perhaps it should be reassigned to a more intensive application.
Furthermore, if the vehicle seems to have frequent suspension related repairs, a dual wheel vehicle with a greater GVWR may be a more suitable specification than the existing one.
Approaches to Replacement
The following are three approaches that may be used in determining when to replace a vehicle:
Conduct an economic lifecycle analysis to estimate the optimum replacement point that results in the lowest total overall cost over the vehicle’s life.
Replace at an established age and/or mileage criteria.
Replace when the cost to repair exceeds a threshold amount.
1. Economic Lifecycle Analysis
An economic lifecycle analysis is a management tool to analyze total ownership and operating costs throughout a vehicle’s life to estimate the optimum point in time or usage to replace the vehicle.
While this approach is quite flexible and comprehensive, it requires extensive amounts of data and can be complicated to implement, since it involves quantifying many parameters like downtime, obsolescence, and other cost factors.
It is also predicated on the assumption that future maintenance costs can be forecasted based on analysis of historical maintenance costs. Often, consultants may be needed to help fleet managers with the process.
The economic lifecycle approach can be used to both set up guidelines by vehicle class before units go into service; and after they have been in service evaluate whether individual vehicles should remain in service for an additional year. It also can be used to evaluate:
Alternative vehicle designs or makes by assessing whether vehicles with higher capital costs have sufficiently lower operating expenses to justify acquiring them.
The economics of whether a unit should be rebuilt.
Figure 1 illustrates an idealized representation of lifecycle costs for a medium vehicle that has an initial cost of $60,000. Note how certain costs such as maintenance and repair expense increase over time or usage, and other costs such as depreciation expense decline. (Fuel expenses are not being shown for simplicity.) The optimum life coincides where the EUAC (Equivalent Uniform Annualized Cost) reaches a minimum, which in this example is year nine. Its computation involves present worth arithmetic.
The typical parameters used in economic life cycle analysis consist of: vehicle purchase cost, cost of money or interest rate, maintenance and repair expenses, amount of miles traveled or hours used per year, downtime costs, fuel expenses, annual depreciation expenses, obsolescence costs, and salvage value.
The total lifecycle cost, or EUAC curve, often does not appear as a nicely shaped “U” curve often seen in textbooks. Instead, it typically is a much flatter or asymptotic curve, as illustrated in Figure 1.
In this situation, the curve declines fairly rapidly in its early years and then very slowly before reaching a minimum, if at all. Then, some judgment must be applied to interpret the results.
Fleet managers should focus on the trending in maintenance and repair costs and note where they rise sharply to set the recommended cycle before that point is reached.
2. Focusing on Age and/or Mileage
This is a common method used in many public and private fleet operations, such as eight years/100,000 miles. It is simple to use and objective.
This method’s chief disadvantage is that, by relying on age or mileage criteria alone, variations in vehicle condition within the class are not accounted for. Some units within the same vehicle class may be more reliable and less costly to operate than others in the class. Thus, less reliable vehicles could inadvertently be kept in service longer than they should be and incur costly repairs. Other vehicles may be removed from service sooner than they should be even though they may have several years of service life left before incurring major repairs.
The best practice approach is to treat units that reach their target age or mileage criteria as “candidates” for replacement.
These best practice fleets will also monitor the maintenance and repair costs by individual vehicle to see if the vehicle’s costs significantly exceed the average maintenance and repair costs within its vehicle class.
Many modern fleet management software programs automate this process by identifying those units meeting age and mileage criteria and having maintenance and repair expenses exceeding the average of their class. Sometimes the software will compute a weighted total “score” to rank the replacement candidates in order of priority for replacement.
3. Exceeding a Threshold Cost
The intent of replacing a vehicle when its repair costs exceed a threshold amount is to replace it before a major repair occurs. Examination of historical trends in repair costs over time should reveal at what point they start to increase significantly.
The Naval Facilities Engineering Command (NAVFAC) has developed such an approach by publishing factors that relate the maximum amount that should be spent on a repair given the present age and life expectancy of the unit. The factors, expressed in percentage points, are multiplied by the cost of the original vehicle to establish the maximum amount that should be spent on its repair at that point in time. If the repair costs more than this amount, the vehicle should be replaced.
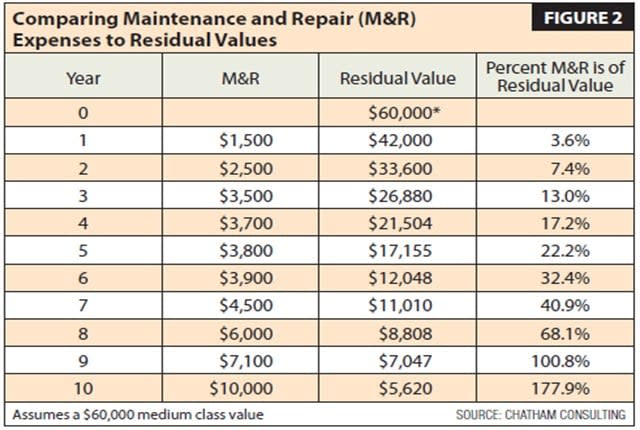
As shown above, a 30 percent threshold is reached just before year six, an ideal time to review the vehicle for replacement before major repairs are needed. Source: Chatham Consulting
4. Exceeding Value of the Vehicle
Unfortunately, there are many instances where a fleet organization spends more money repairing a vehicle than it is worth, sometimes without realizing it. They are, in effect, trading operating dollars for capital dollars. In some cases they may have little choice if their capital budgets are highly constrained or reduced. But, best practice fleets will document and then explain to financial management the impact of reduced capital spending on their need for more repair (i.e., operating funds) without which will result in a degradation of vehicle availability.
This situation is further exacerbated if fleets do not use fully burdened labor rates in pricing their labor and therefore underestimate their internal maintenance and repair expense. Occasions exist where a fleet manager will simply divide 2,080 hours per year into their mechanic’s annual wages.
These fleets should recognize that need to deduct non-productive time like vacations, holidays, and sick time, and then add in the costs of shop overheads like supervision and facility costs. They will find that their mechanics are only able to charge 1,350 hours, or 65 percent, of their time to direct work, and that their labor rate is $75 to $95 per hour — not $20 per hour.
5. Cost of Repair vs. Residual Value
Even if a fleet organization monitors their maintenance and repair expenses, if they wait until the expenses become so high to be greater than the vehicle is worth, it is too late. They are performing reactive repairs which are expensive. Instead, a more proactive approach, as described below, should be used.
In this approach that we use, an informed decision is made on whether to repair, rebuild, sell, scrap, or cannibalize a vehicle based on the costs of the repair and the residual or market value of the vehicle. Any vehicle or equipment unit with a maintenance cost that is 30 percent or more of the vehicle’s residual value should be assessed for replacement.
As illustrated in Figure 2, the 30-percent threshold that is reached just before year six provides sufficient time to evaluate the vehicle’s condition and begin to plan for its replacement before major repairs are needed in years eight through 10.
An assessment report (matrix) should be completed of those units that reach the 30-percent threshold. Digital pictures should be taken of the four sides and roof of the vehicle, and any exceptional items should be noted.
Units with the lowest matrix scores should be annotated with a summary of cumulative operating expenses and their estimated replacement costs. The results can be used to guide decisions during the budget preparation process on whether to repair, rebuild, or scrap the unit. If a vehicle or component can be rebuilt at 50 percent of the cost for a new unit and be able to extend the life of the vehicle or component by 75 percent of that of a new unit, it is worthwhile to rebuild. For accident repairs, allow expenditures up to 50 percent of the vehicle’s value.
In addition, the vehicle’s utilization should be evaluated and taken into account to determine whether to replace the unit at all. If the vehicle has consumed less than 500 gallons of fuel or been used less than 2,500 miles during the past 12 months, it should be evaluated whether it still is needed.
The Bottom Line
We have seen that there is a variety of approaches to calculate the optimal service months and replacement cycles. Each has its own set of advantages and disadvantages to consider. Some are easier to use than the others; however, they all require data on maintenance and repair expenses. Without this information, the organization may have little choice than to rely on some other fleet’s replacement guidelines.
The best approach to replacing medium-duty trucks:
Accounts for the organization’s specific needs.
Evaluates more than one factor.
Reviews vehicle condition.
Considers trade-offs of capital versus operating expenditures.
Examines whether as well as when to replace.
Considers leasing.
Applies good judgment.
Sal Bibona is president of Chatham Consulting, Inc., and can be reached at (973) 966-9262 or slb@chathamconsulting.com.
Originally posted on Automotive Fleet
More Vehicle Research

Electrification Incentives: The Acquisition Windfall Fleets Can't Miss
Discover how fleets can use tax credits, grants, rebates, and vouchers to dramatically reduce electric truck and charging infrastructure costs—before today’s funding disappears.
Read More →
Top 50 Executive Fleets
It is that time of year again! Time for the 2026 list of the Top 50 Executive Fleets, presented by Automotive Fleet and Volvo as part of its annual Fleet 500. Download now to see this year's list of companies!
Read More →
Back at Star Nation for a Closer Look at Western Star Trucks and the People Behind Them
Work Truck returned to Western Star’s Star Nation Experience for another hands-on look at the trucks, technology, and operator community behind the brand.
Read More →

The Top 300 Commercial Fleets
The Top 300 Commercial Fleets: See the List
Read More →
Mack Defense Receives Additional Order for 115 Heavy Dump Trucks Under U.S. Army’s M917A3 Program
The latest order of 115 Heavy Dump Trucks (HDTs) from Mack Defense for the National Guard is part of the $47-million order from the U.S. Army approved in the 2026 National Defense Appropriations Act.
Read More →
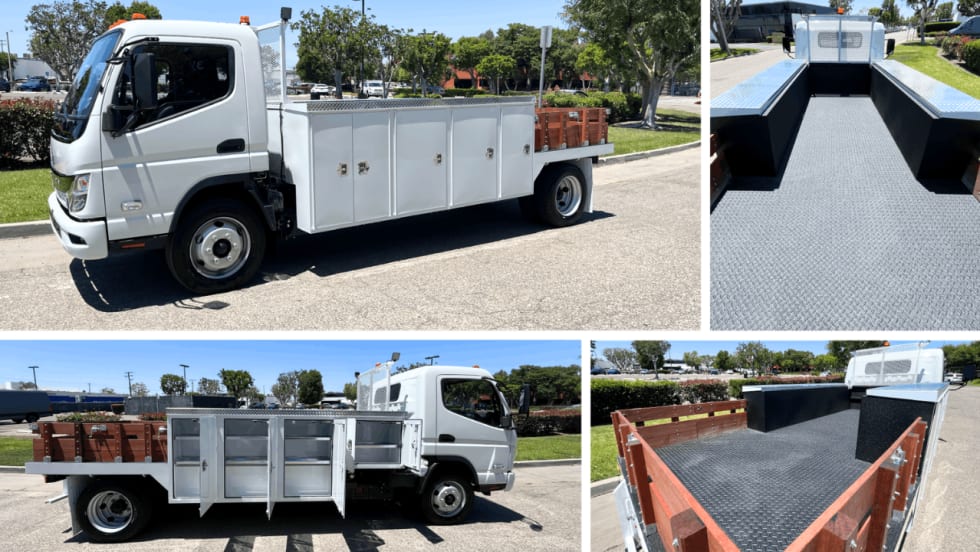
Rizon Introduces Service Combo Body, Increases Electric Truck Applications
Rizon now offers a combo service body that combines lockable storage and a spacious cargo bed in a single zero-emission vehicle. The body supports unique options including cranes, ladder racks, generators, lift gates, and work lighting for a wide range of vocational applications.
Read More →
MFTBC Establishes FUSO Academy Dubai Training Center to Strengthen Network Capabilities in Middle East & Africa
Mitsubishi Fuso Truck and Bus Corporation’s new FUSO Academy Dubai Training Center will support technical and non-technical capability development. It features enhanced training infrastructure to improve service quality, uptime, and readiness for advanced vehicle technologies.
Read More →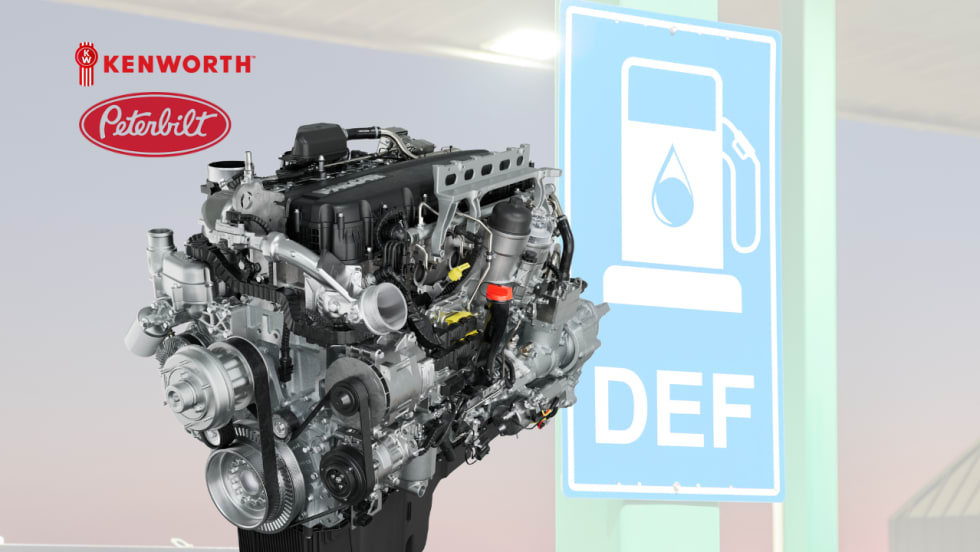
Paccar Updates MX-11 and MX-13 Engine Software to Enhance Customer Operations
Kenworth Truck Company and Peterbilt Motors Company will update software for vehicles equipped with Paccar MX-11 and Paccar MX-13 engines to ensure they comply with EPA guidance on diesel exhaust fluid inducements.
Read More →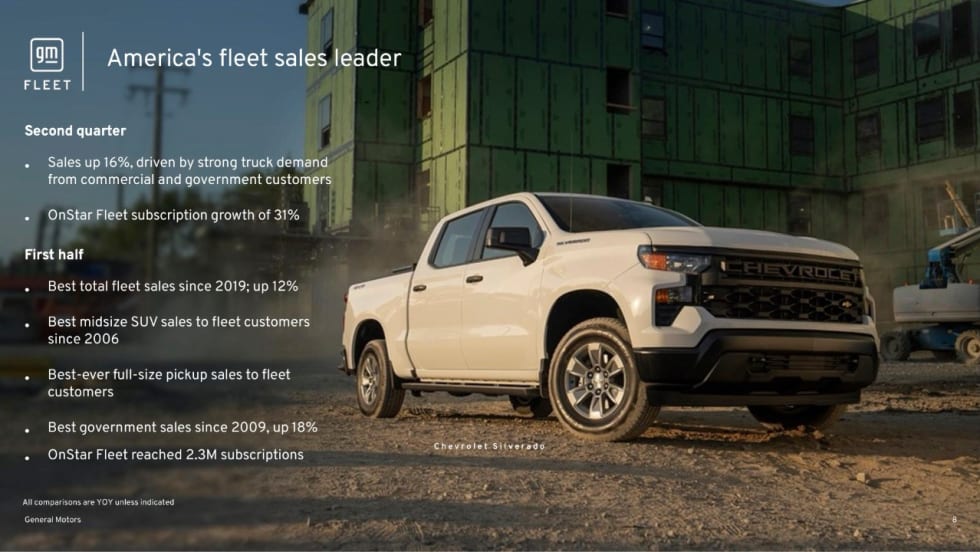
GM #1 in U.S. Sales for the Second Quarter of 2026
General Motors said it was America’s #1 automaker in U.S. sales for the second quarter of 2026 with total sales of 714,896 vehicles, down 4.2%. GM led in full-size pickup and large SUV sales and reported growth in fleet sales.
Read More →