



Edmunds.com Reports Incentives at Highest Level in History
Edmunds.com (www.edmunds.com), the online resource for automotive information, reported that the average manufacturer incentive per vehicle sold in the United States was $2,532 in May 2003, up $606 or 31.5 percent from May 2002 and up $271 or 10.7 percent from April 2003. Industry average "days-to-turn," which measures how many days on average it takes to sell a vehicle after it hits the dealer's lot, reached a record level of 69 days in May 2003 compared to 66 in April 2003 and 54 days in May 2002. Edmunds.com's monthly True Cost of Incentives (TCI) report takes into account all of the manufacturers' various United States incentives programs, including subvented interest rates and lease programs as well as cash rebates to consumers and dealers. To assure the greatest possible accuracy, Edmunds.com says it bases its calculations on sales volume, including the mix of vehicle makes and models for each month, as well as on the proportion of vehicles for which each type of incentive was used. Incentives spending for domestic Chrysler, Ford and General Motors nameplates averaged a record high of $3,389 per unit in incentives in May, compared to $1,945 for European automakers, $1,371 for Korean automakers, and $1,062 for Japanese automakers. According to Edmunds.com, Ford increased incentives spending by 14.8 percent for the month, to $3,219 per unit, but saw its market share fall 0.7 percent to 19.2 percent. General Motors' increased its incentives spending 10.3 percent for the month, to $3,675 per unit, while its market share decreased from 0.3 percent to 26.9 percent in May. Chrysler increased its incentives spending by only $59 to $3,059 this month, and increased its market share 0.5 percent to 13.8 percent in May. By contrast, incentives on Toyota vehicles reached a recent high of $1086 per unit, up $348 or 47.1 percent from April, while its market share rose to 10.4 percent in May from 9.3 percent in April. The luxury car segment had the highest monthly increase in incentives, up 29 percent in May to $3,278 per unit, while essentially maintaining its market share. Manufacturers more then tripled their incentives spending for compact SUV segment, to $1,659 in May 2003 from $513 in January 2002. In the same period, compact SUV market share went up from 3.7 percent to 4.1 percent. "Domestic manufacturers are getting creative with incentives, matching down payments and offering holiday promotions in May - and increasing their incentives spending in the process," stated Dr. Jane Liu, executive director of data analysis for Edmunds.com. "It remains to be seen if these tactics will help to create buyers for the aging inventories, or if it will only attract those shoppers who are waiting for the next great deal before taking their inevitable steps into the marketplace." About Edmunds.com True Cost of Incentives (TCI) Edmunds.com says TCI is a comprehensive monthly report that measures automobile manufacturers' cost of incentives on vehicles sold in the United States. These costs are reported on a per vehicle basis for the industry as a whole, for each manufacturer, for each make sold by each manufacturer and for each model of each make. TCI covers all aspects of manufacturers' various incentives programs (except volume and similar bonus programs), including dealer cash, manufacturer rebates and consumer savings from subvented APR and lease programs (including subvented lease residual values used in manufacturer leasing programs). Data for the industry, the manufacturers and the makes are derived using weighted averages and are based on actual monthly sales and financing activity. About Edmunds.com, Inc. Edmunds.com (www.edmunds.com) is an online resource for automotive information. Its comprehensive set of data, tools and services, including Edmunds.com True Market Value® pricing, is generated by Edmunds Data Services and is licensed to third parties. For example, the company supplies over 800,000 pages of content for NYTimes.com's auto section and delivers monthly data reports to Morgan Stanley. The company is headquartered in Santa Monica, California and maintains a satellite office in Troy, Michigan.
More Small Fleet

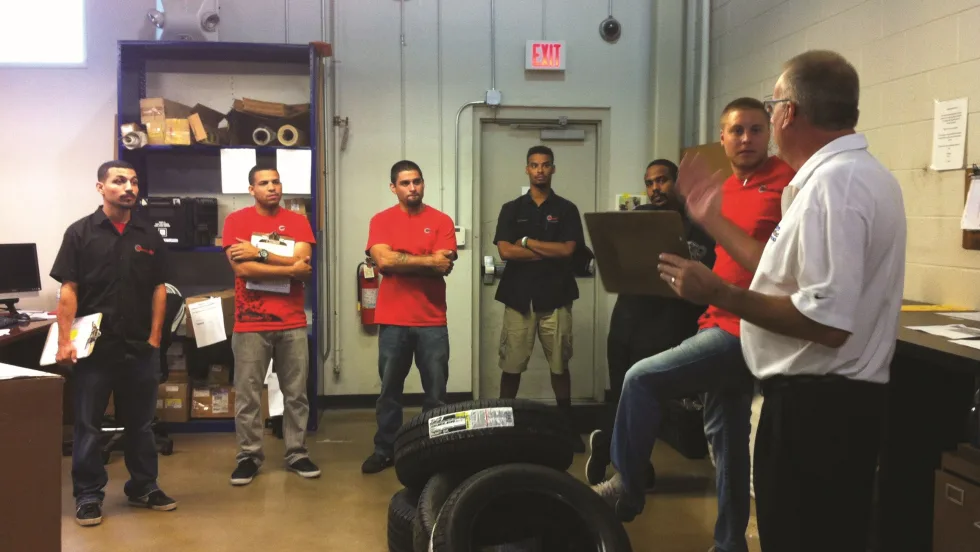
Developing Budget-Friendly Driver Safety Programs
From driver training and safety meetings to one-on-one coaching and incentive programs, several small fleets share how they have developed a safety culture with their drivers using low- to no-cost resources.
Read More →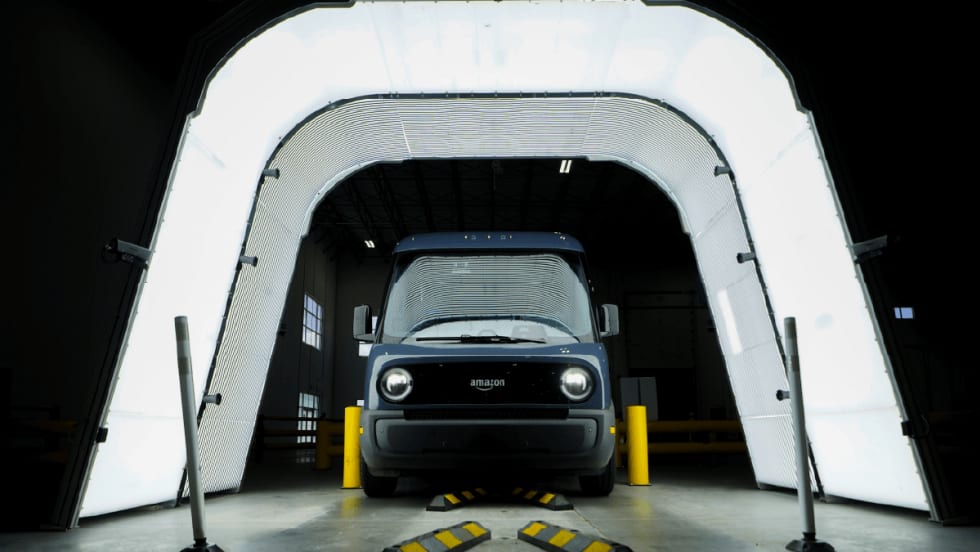
Boosting Last-Mile Fleet Uptime, Safety, and Value with AI Vehicle Inspections
AI-powered inspections are transforming last-mile fleets by replacing manual checks with highly accurate automated scans that detect defects in seconds. By giving fleet operations visibility into the daily condition of their vehicles, you can identify trends over the vehicle’s lifecycle that enable improved procurement decisions, route management, driver training and accountability.
Read More →

Five Ways Seat Belts Help Prevent Injuries
There are five ways seat belts protect occupants from injuries, according to the Tennessee Department of Safety and Homeland Security.
Read More →
Basic Tracking vs Next Generation Fleet Technology
Fleet software is getting more sophisticated and effective than ever, tying big data models together to transform maintenance, safety, and the value of your existing tech stack. Fleet technology upgrades are undoubtedly an investment, but updated technology can offer a much higher return. Read how upgrading your fleet technology can increase the return on your investment.
Read More →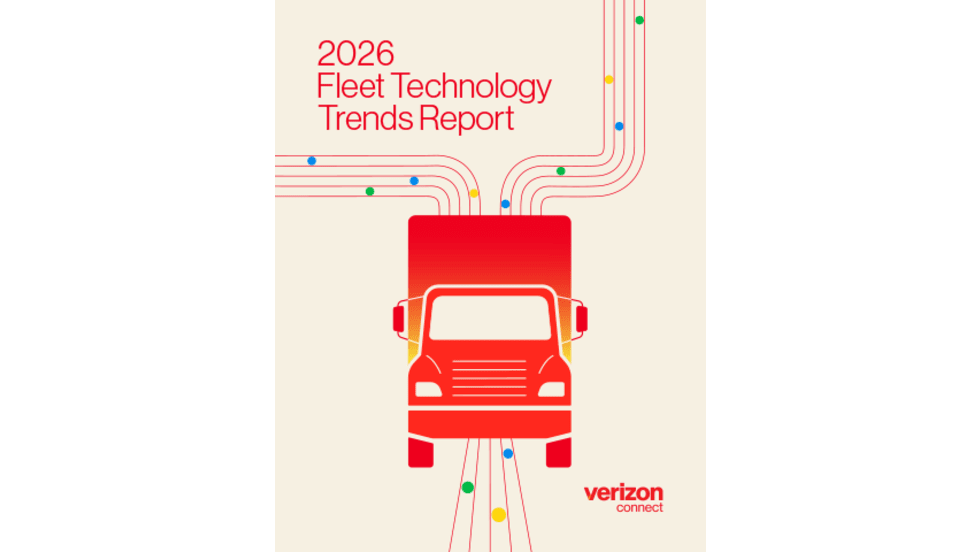
It’s here: The 2026 Fleet Technology Trends Report
What does AI mean for fleets? Get the answer — and learn other top tech trends.
Read More →
Small Fleets, Big Impact: How Independent Drivers Power Wreaths Across America
Check out how small fleets and independent drivers power Wreaths Across America each December and why their impact matters more than ever.
Read More →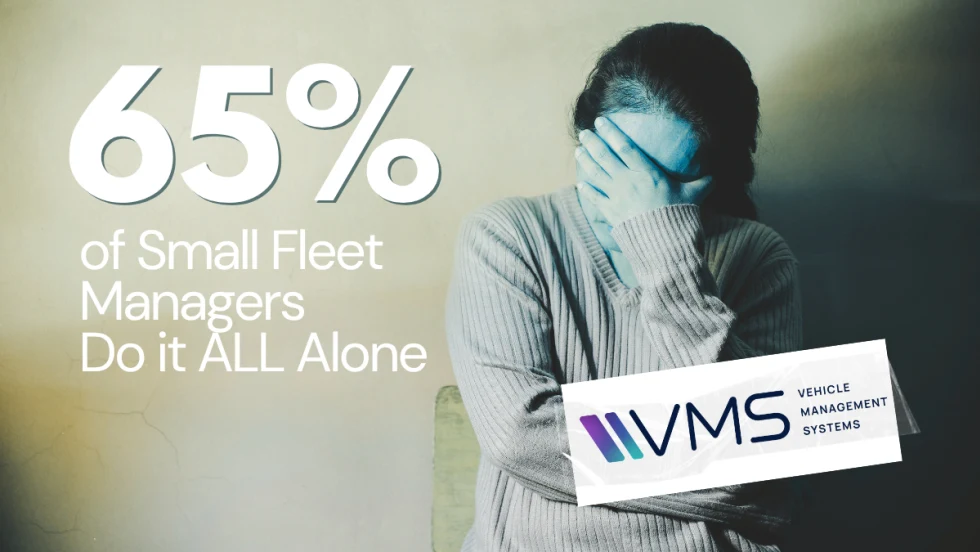
VMS Survey Finds 65% of Small Fleet Managers Run Operations Alone
A new VMS survey shows small fleet managers are stretched thin, with most handling operations solo and eager to adopt digital tools for relief.
Read More →
Tips for Driving Safely on Halloween Night
This video features a reminder from the Connecticut Department of Transportation (DOT) and the Connecticut Police Chiefs Association, urging drivers to prioritize safety this Halloween.
Read More →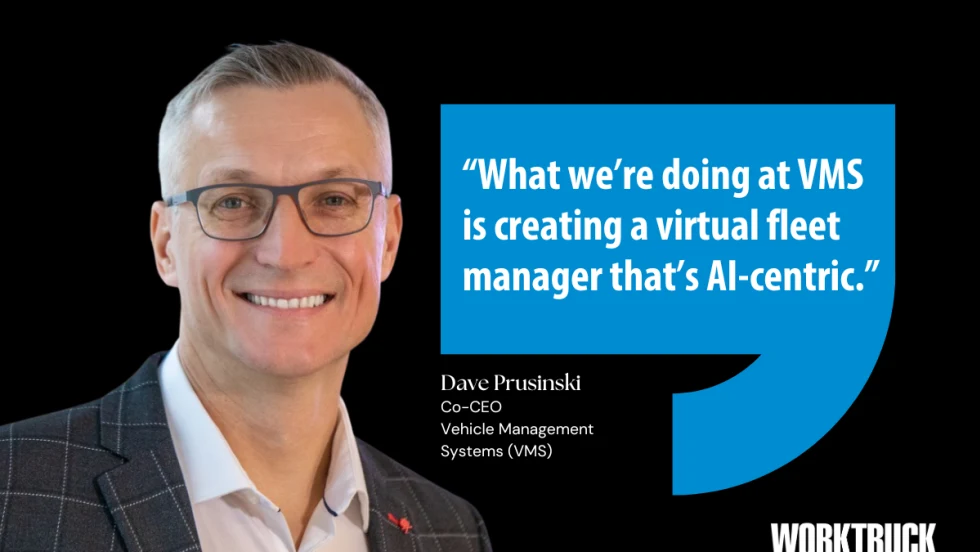
AI, Access, and Uptime: VMS’s Next Chapter with David Prusinski
VMS’s new Co-CEO, David Prusinski, shares how an AI-first approach will give small fleets and repair shops the tools to compete like big players.
Read More →