


Read More: Automotive & Fleet Outlook: Cautious Optimism to Start 2024
Depreciation Drives TCO Increases in Q4
According to Vincentric, fleet costs per mile for most vehicle categories increased slightly in the fourth quarter, tempered by falling fuel prices.
January 10, 2024
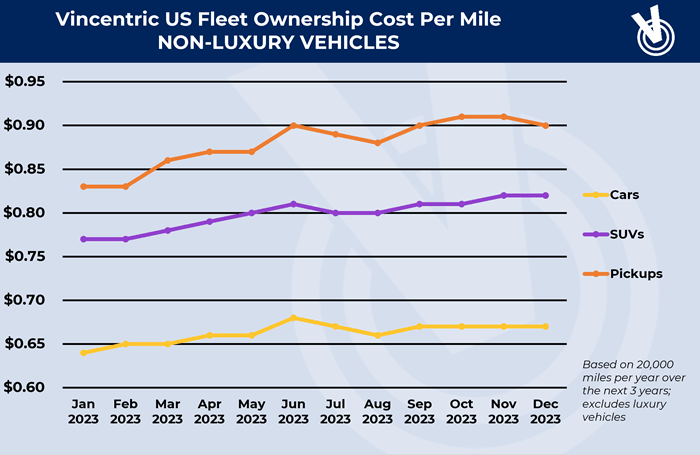
Ownership costs for the pickup category crested the $ .90-per-mile mark for the first time, then cooled to end the year. Car and SUV costs have been less volatile over the past few quarters with an overall moderate rise.
Photo: Vincentric
2 min to read
Welcome to the latest installment of Fleet Data Depot, which provides snapshots of information, trends, and analysis relevant to the fleet market.
The total cost of ownership experts at Vincentric deliver another quarterly update on per-mile ownership costs for fleets over the previous 12 months. These fleet cost-per-mile calculations are for the fourth quarter of 2023.
This analysis is based on vehicles driven 20,000 miles per year for three years. As usual, Vincentric calculates its standard eight cost elements: depreciation, financing, fees and taxes, fuel, insurance, maintenance, opportunity cost, and repairs.
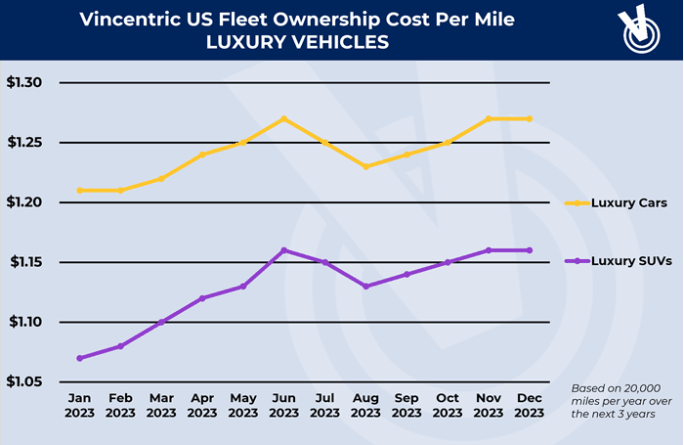
Ownership costs for luxury passenger cars and SUVs have been on an uneven yet steady rise over the past few quarters, with average costs per mile now at or close to all-time highs.
Photo: Vincentric
Cost Per Mile Increases
The fleet costs per mile for most vehicle categories increased slightly in the fourth quarter of 2023, though the Passenger Cars and Pickups categories remained the same:
Luxury Car: increased by ~2.4%
Luxury SUVs: increased by ~1.8%
Passenger Cars: 0% change
Pickups: 0% change
SUVs: increased ~1.2%
The fourth-quarter data contrasts with the third quarter, in which costs for most vehicle categories decreased slightly, though the Pickups and SUVs categories remained the same over the previous quarter.
The increases in cost per mile were primarily caused by increases in depreciation costs, which ranged from 6% to 7% higher on average in the quarter compared to the previous quarter. According to Vincentric, the increase is likely primarily due to the high number of MY24 vehicles it has received from its data provider since last quarter.
Although depreciation costs increased, Vincentric noted that fuel costs for all segments decreased by 7% to 10% compared with the third quarter.
To understand up-to-date lifecycle costs and fleet incentives based on model and class, visit here.
Originally posted on Automotive Fleet
More Small Fleet

Developing Budget-Friendly Driver Safety Programs
From driver training and safety meetings to one-on-one coaching and incentive programs, several small fleets share how they have developed a safety culture with their drivers using low- to no-cost resources.
Read More →
Sponsored•May 13, 2026
Why Fleet Managers Are Replacing Departmental Vehicles with Shared Motor Pools
Departmentally assigned vehicles often create hidden costs through underutilization, poor visibility, and increased administrative burden. This white paper explores how shared motor pool strategies help fleets reduce costs, improve accountability, and optimize vehicle utilization.
Read More →
Sponsored•March 9, 2026
Boosting Last-Mile Fleet Uptime, Safety, and Value with AI Vehicle Inspections
AI-powered inspections are transforming last-mile fleets by replacing manual checks with highly accurate automated scans that detect defects in seconds. By giving fleet operations visibility into the daily condition of their vehicles, you can identify trends over the vehicle’s lifecycle that enable improved procurement decisions, route management, driver training and accountability.
Read More →
Five Ways Seat Belts Help Prevent Injuries
There are five ways seat belts protect occupants from injuries, according to the Tennessee Department of Safety and Homeland Security.
Read More →
Sponsored•January 14, 2026
It’s here: The 2026 Fleet Technology Trends Report
What does AI mean for fleets? Get the answer — and learn other top tech trends.
Read More →
Small Fleets, Big Impact: How Independent Drivers Power Wreaths Across America
Check out how small fleets and independent drivers power Wreaths Across America each December and why their impact matters more than ever.
Read More →
VMS Survey Finds 65% of Small Fleet Managers Run Operations Alone
A new VMS survey shows small fleet managers are stretched thin, with most handling operations solo and eager to adopt digital tools for relief.
Read More →
Tips for Driving Safely on Halloween Night
This video features a reminder from the Connecticut Department of Transportation (DOT) and the Connecticut Police Chiefs Association, urging drivers to prioritize safety this Halloween.
Read More →
AI, Access, and Uptime: VMS’s Next Chapter with David Prusinski
VMS’s new Co-CEO, David Prusinski, shares how an AI-first approach will give small fleets and repair shops the tools to compete like big players.
Read More →