

WEX: Gasoline Prices Lowest Since January
According to WEX’s September fuel prices report, the national average dropped more than 20 cents per gallon to $3.37 — 40 cents per gallon lower than a year ago.

This chart details the price trends for unleaded gasoline and diesel fuel since 2011. Chart courtesy WEX Inc.
The national average dropped more than 20 cents per gallon to $3.37 – its lowest level since late January of this year, according to WEX’s September fuel prices report. Compared to last year, prices are down by more than 40 cents per gallon, noted WEX.
For fleet managers, the good news is that many analysts are predicting further declines; some are even saying that the national average could decrease to $3 per gallon before the year ends, says WEX.
Already, 2.3% of all gas stations in the country are priced below $3 per gallon while only 1.1% of stations are above $4. But last year, no stations were below $3 per gallon and nearly 17% were above $4, according to WEX. In some states, some stations are priced near $2.80. For example, almost 30% of stations in Missouri are priced under $3 per gallon, says WEX.
With the exception of Alaska and Hawaii, the most expensive state is California — with an average of $3.90 per gallon, says WEX. But even in the Golden State, one could find gas stations with prices below $3.50 per gallon.
According to WEX, it is typical for prices to fall after the high volume of drivers in the summertime and the switch back to cheaper winter grade of fuel. In addition, this year is also benefitting from the relatively mild storm season. Though wild weather could still disrupt prices, most experts believe the remainder of the year should continue to see prices decline, says WEX.
Meanwhile, diesel prices are hovering at $3.90 per gallon. Unfortunately, most market-watchers anticipate a slow but steady rise in diesel prices.
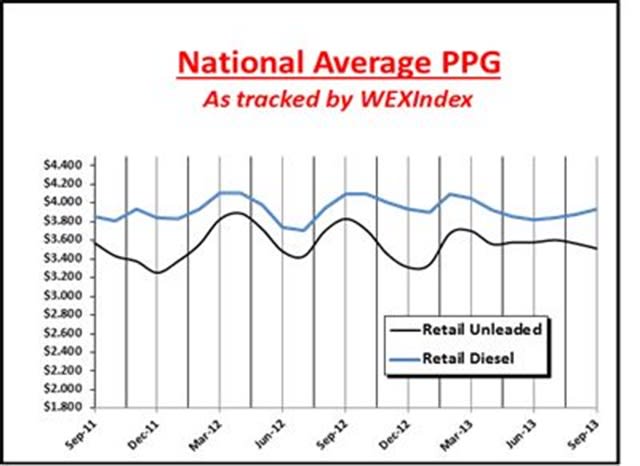
This chart details the price trends for unleaded gasoline and diesel fuel since 2011. Chart courtesy WEX Inc.
More Small Fleet

Developing Budget-Friendly Driver Safety Programs
From driver training and safety meetings to one-on-one coaching and incentive programs, several small fleets share how they have developed a safety culture with their drivers using low- to no-cost resources.
Read More →
Why Fleet Managers Are Replacing Departmental Vehicles with Shared Motor Pools
Departmentally assigned vehicles often create hidden costs through underutilization, poor visibility, and increased administrative burden. This white paper explores how shared motor pool strategies help fleets reduce costs, improve accountability, and optimize vehicle utilization.
Read More →
Boosting Last-Mile Fleet Uptime, Safety, and Value with AI Vehicle Inspections
AI-powered inspections are transforming last-mile fleets by replacing manual checks with highly accurate automated scans that detect defects in seconds. By giving fleet operations visibility into the daily condition of their vehicles, you can identify trends over the vehicle’s lifecycle that enable improved procurement decisions, route management, driver training and accountability.
Read More →
Five Ways Seat Belts Help Prevent Injuries
There are five ways seat belts protect occupants from injuries, according to the Tennessee Department of Safety and Homeland Security.
Read More →
It’s here: The 2026 Fleet Technology Trends Report
What does AI mean for fleets? Get the answer — and learn other top tech trends.
Read More →
Small Fleets, Big Impact: How Independent Drivers Power Wreaths Across America
Check out how small fleets and independent drivers power Wreaths Across America each December and why their impact matters more than ever.
Read More →
VMS Survey Finds 65% of Small Fleet Managers Run Operations Alone
A new VMS survey shows small fleet managers are stretched thin, with most handling operations solo and eager to adopt digital tools for relief.
Read More →
Tips for Driving Safely on Halloween Night
This video features a reminder from the Connecticut Department of Transportation (DOT) and the Connecticut Police Chiefs Association, urging drivers to prioritize safety this Halloween.
Read More →
AI, Access, and Uptime: VMS’s Next Chapter with David Prusinski
VMS’s new Co-CEO, David Prusinski, shares how an AI-first approach will give small fleets and repair shops the tools to compete like big players.
Read More →