

Report Compares Half-Ton Pickup Costs, Uses in Utility Fleets
A report from Utilimarc looking at more than 5,500 half-ton pickups from the company’s utility clients, compares operating costs, average miles driven, acquisition costs and repairs of 4x2 versus 4x4 half-ton pickups.
Graphs courtesy of Utilimarc.

Graphs courtesy of Utilimarc.
A report from Utilimarc looking at more than 5,500 half-ton pickups from the company’s utility clients, compares operating costs, average miles driven, acquisition costs and repairs of 4x2 versus 4x4 half-ton pickups.
The graphs are derived from the data of 40 utility clients and their active half-ton pickups. The sample included more than 5,500 F150s and Chevy 1500s. The data being used is representing the patterns Utilimarc has seen from the industry average of the selected sample.
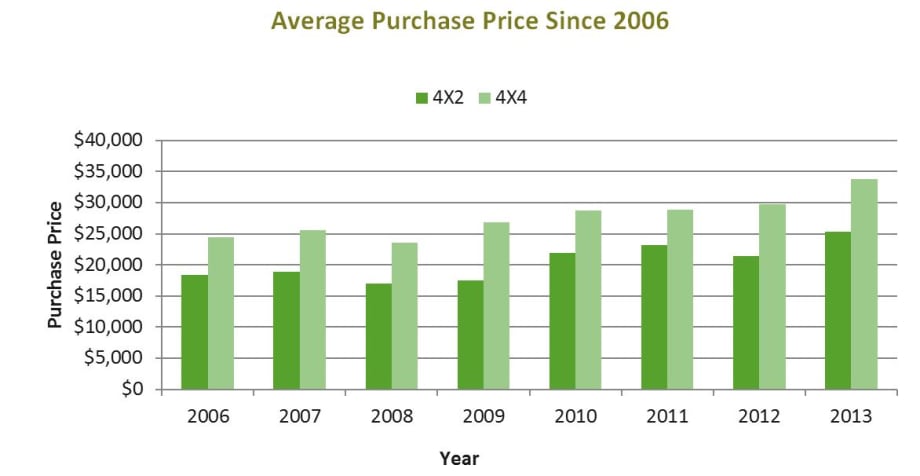
Average Purchase Price Since 2006
This graph shows the average purchase price of ½ ton pickups over the past 7 years, broken down by drive type. The overall trend for both drive types is that the average purchase price is increasing.
From 2006 to 2013, the average purchase price for a 4x2 increased from $18,399 to $25,275, which is an increase of over 37%.
From 2006 to 2013, the average price for the 4x4 increased from $24,487 to $33,719, which is an increase of over 33%.

Operating Costs (Without Fuel) Per Mile
This graph shows the operating cost (all parts and labor) net of fuel per mile for 4x2 and 4x4 ½ ton pickups by age. The overall trend for both drive types is that the operating cost per mile is increasing.
The operating costs for 4x2 in year one was $0.10 per mile, while in year 10 it was $0.25 per mile, an increase of $0.15 over the 10 years. The average operating cost per mile for a 4x2 pickup over the same 10-year period was $0.16.
The operating costs for 4x4 in year one was $0.10 per mile, while in year 10 it was $0.24 per mile, the increase of $0.14 over the 10 years. The average operating cost per mile for a 4x4 pickup over the same 10-year period was $0.16.

Average Miles Driven by Year
This graph shows the average miles driven from 2009 to 2013 for the 4x2 and 4x4. The annual average miles driven has steadily decreased for both drive types.
In 2006 the average annual miles driven for the 4x2 was 13,181 and in 2013 the average was 11,693, a decrease of 1,488 since 2006.
In 2006 the average annual miles driven for the 4x4 ½ ton pickup was 16,312 and in 2013 the average was 15,203, decreasing by 1,109.
For the data set above, the 4x4 pickup has historically driven more miles annually than the 4x2. For 2013 the 4x4 was driven an average of 3,510 more miles than the 4x2.

Average Number of Days between Unscheduled/Demand Repair by Year
This graph shows the average number of days between an unscheduled/demand repair event from 2009-2013 for the 4x2 and 4x4.
For 2013 the data shows that the gap between an unscheduled/demand repair event between the 4x2 and 4x4 has closed. The data also shows the average number of days between an unscheduled/demand repair event has increased/improved for both drive types since 2009. The 4x2 increased from 68.5 to 80.7 days and the 4x4 increased from 73.1 to 79.1 days.

Average Age Since 2009
This graph shows the average age of vehicles from 2009-2013 for the 4x2 and 4x4.
We can see that the average age of both the 4x2 and 4x4 has increased since 2009.
The average age for the 4x2 increased by 1.35 years from 2009 and 2013, while the 4x4 increased by 0.75 years from 2009 to 2013.

Drive Type Percentage Since 2009
This graph shows the drive type percentage breakdown of ½ ton pickups between 2009-2013. The 4x4 drive type percentage has seen a steady increase over time, from 44.2% in 2009 to 58.7% in 2013.
To learn more about the data provided here, go to www.utilimarc.com/demo to request more information, or call 952-955-8804.
More Utility Fleet
Why Utility Fleets Choose the Kenworth T380
The Kenworth T380 is engineered for utility fleets with custom chassis layouts, optimized frame rails, 4x4 capability, and improved driver visibility. See how its design helps maximize upfit flexibility and field performance.
Read More →
PALFINGER PB 38 AT P: Purpose-Built for Telecom Fleets
Purpose-built for telecommunications crews, the PALFINGER PB 38 ATP combines a 43-foot working height, flexible basket stowage, integrated cameras, and operator communication systems to improve productivity and safety during fiber and overhead cable installation.
Read More →
Inside Terex Utilities' Latest Work Truck Innovations
Terex Utilities is advancing utility fleet operations with its new TRX aerial platforms, Flex Pro controls, and AI-powered 3rd Eye safety technology. See how these innovations are helping fleets work safer, smarter, and more productively.
Read More →
Walkaround of International MV607 Digger Derrick
The International MV607 combines advanced safety technologies, excellent visibility, vocational flexibility, and seamless body integration to create a powerful platform for utility fleet operations. Take a closer look at this Altec digger derrick configuration from EUFMC.
Read More →
Inside the Electric Utility Fleet Managers Conference
What is EUFMC? For more than seven decades, the Electric Utility Fleet Managers Conference has served as a hub for collaboration, education, and innovation within the utility fleet industry. In this video, Work Truck talks to EUFMC President Greg Loew to learn more.
Read More →
Inside the EUFMC Equipment Expo & Drive-Through
Follow Work Truck as we check out the trucks and other vehicles that were showcased at the Electric Utility Fleet Managers Conference in Williamsburg, Virginia. Whether looking for something on tires or treads, it was there for fleet managers to see.
Read More →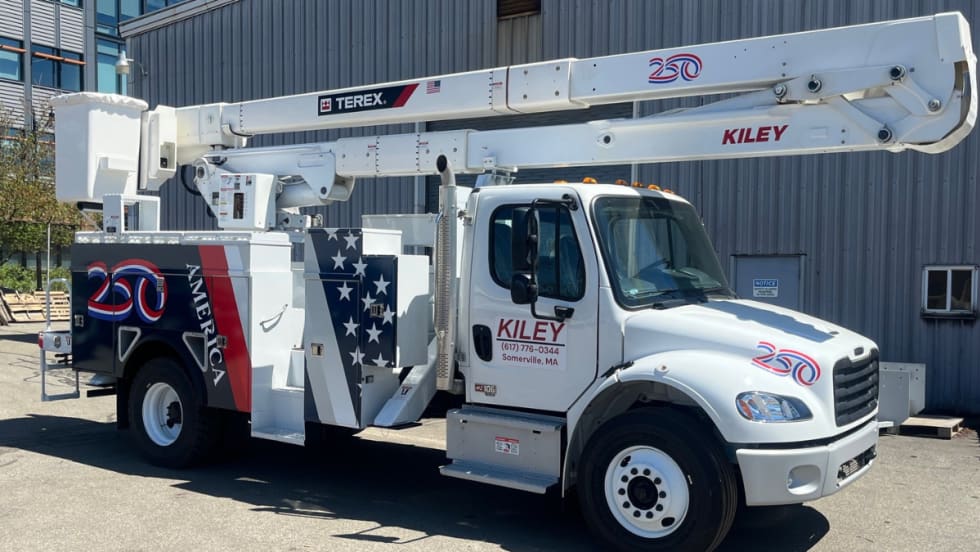
Terex Utilities & Kiley Unveil Custom America 250 Bucket Trucks at EUFMC 2026
Terex Utilities showcased a patriotic spirit in its booth this week during the Electric Utility Fleet Managers Conference in Williamsburg, Virginia, by debuting two custom-wrapped bucket trucks celebrating America’s upcoming 250th anniversary.
Read More →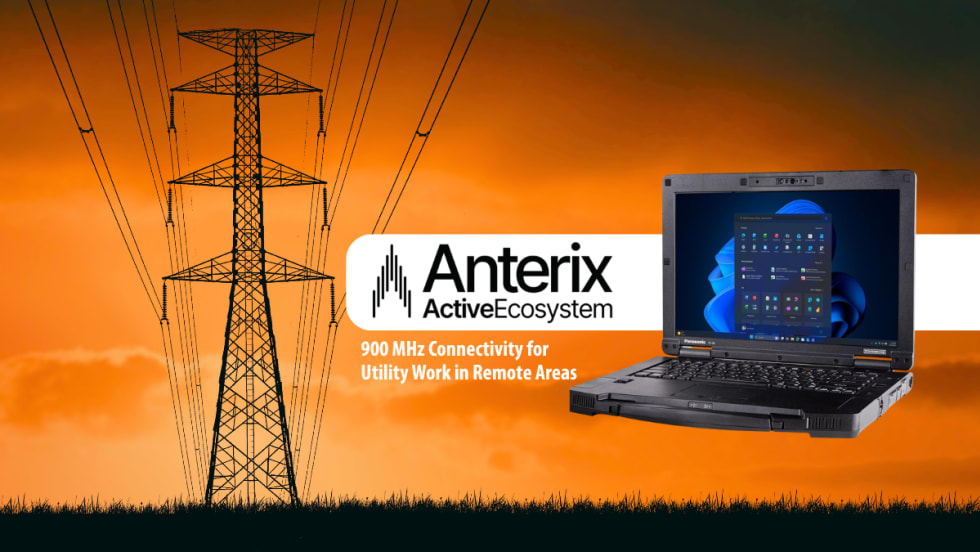
Panasonic Connect & Anterix Strengthen Connectivity Options for Utilities and Field Workers
The Panasonic Connect Toughbook 56 is the first Toughbook to earn the AnterixActive badge, which means it can connect to and operate on Anterix’s 900 MHz network even in the most remote locations.
Read More →
Why Fleet Managers Are Replacing Departmental Vehicles with Shared Motor Pools
Departmentally assigned vehicles often create hidden costs through underutilization, poor visibility, and increased administrative burden. This white paper explores how shared motor pool strategies help fleets reduce costs, improve accountability, and optimize vehicle utilization.
Read More →
Streamlight Launches Portable Scene Light III & LiteBox 1Million
Streamlight has launched its Portable Scene Light III (PSL III), which delivers up to 10,000 lumens, and the LiteBox 1Million, a long-range search light that delivers one million candela.
Read More →