

July 4 Remains Deadliest Driving Day
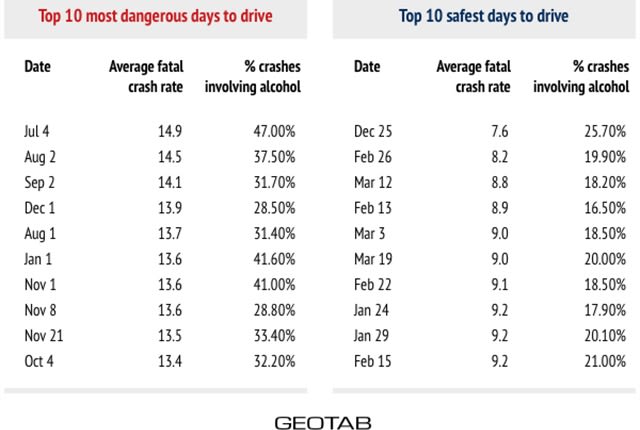
A new study concludes that Independence Day is the most dangerous day of the year to drive, with an average fatal crash rate of 14.9 per billion miles driven.
Source: Geotab
Source: Geotab
The Fourth of July is the most dangerous day to drive in the U.S., according to a new study from Geotab, and AAA forecasts that roughly 37.5 million Americans will take a road trip of at least 50 miles this weekend — up 2.9% from last year.
The National Safety Council said its calculations indicate 582 people may be killed on roads during this holiday weekend period, and an additional 66,900 may be seriously injured in crashes.
July 4 registers an average of 119 deadly crashes and a fatal crash rate of 14.9 per billion miles driven, research from Geotab found. Not surprisingly, July 4 has the highest percentage of fatal crashes involving alcohol or incidents of driving under the influence, with an average of 47%.
On average, 28% of all road crashes are related to alcohol and driving under the influence, but that rate rises significantly around national holidays. New Year’s Day (41.6%) and Halloween (41%), which also landed in Geotab’s top 10 list of most dangerous days to drive, have a high percentage of alcohol-related fatalities, too. Each recorded a fatal crash rate of 13.6.
Geotab’s study analyzed road fatality data over a 10-year period to determine national trends as well as how states in the country differ in road safety. Geotab is a telematics and GPS vehicle tracking company. Based on its findings, the company created an interactive map that indicates the most dangerous day to drive in each individual state. Click here to access the map.
Geotab researchers also found that July, August and September are the most dangerous months in which to drive, with each registering an average fatal crash rate of 12.
The top 10 most dangerous states for road deaths are Montana, South Carolina, West Virginia, Louisiana, Arkansas, Mississippi, Kentucky, Alabama, Tennessee and South Dakota, according to the study.
In its research, Geotab relied on road traffic, crash and fatality reports, including the Fatality Analysis Reporting System and Traffic Volume Trends — databases managed by agencies within the U.S. Department of Transportation.
Using this data, Geotab calculated a fatal crash rate for each day and U.S. state, made up of the total number of fatal road accidents per billion miles driven by cars, trucks and motorcycles.
Source: Geotab.
Originally posted on Automotive Fleet
More Small Fleet

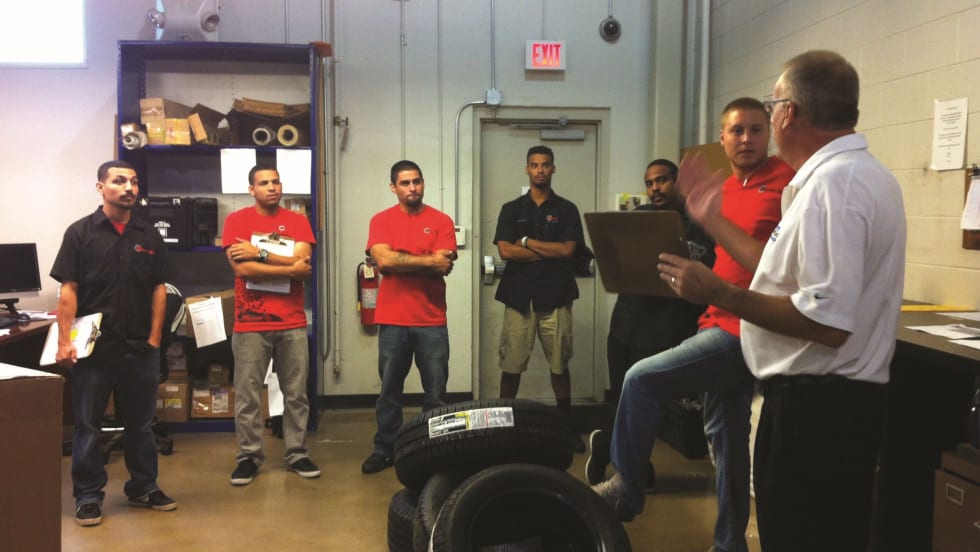
Developing Budget-Friendly Driver Safety Programs
From driver training and safety meetings to one-on-one coaching and incentive programs, several small fleets share how they have developed a safety culture with their drivers using low- to no-cost resources.
Read More →
Why Fleet Managers Are Replacing Departmental Vehicles with Shared Motor Pools
Departmentally assigned vehicles often create hidden costs through underutilization, poor visibility, and increased administrative burden. This white paper explores how shared motor pool strategies help fleets reduce costs, improve accountability, and optimize vehicle utilization.
Read More →
Boosting Last-Mile Fleet Uptime, Safety, and Value with AI Vehicle Inspections
AI-powered inspections are transforming last-mile fleets by replacing manual checks with highly accurate automated scans that detect defects in seconds. By giving fleet operations visibility into the daily condition of their vehicles, you can identify trends over the vehicle’s lifecycle that enable improved procurement decisions, route management, driver training and accountability.
Read More →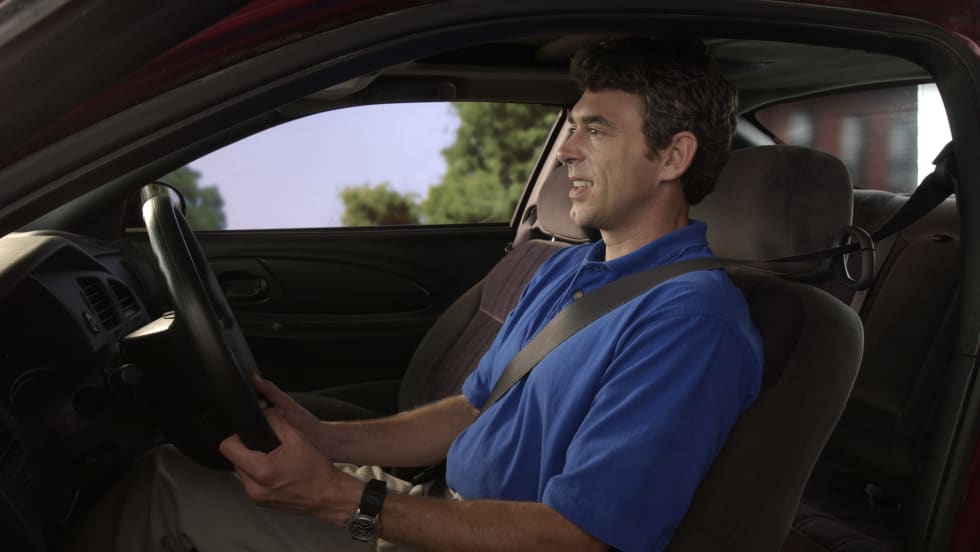
Five Ways Seat Belts Help Prevent Injuries
There are five ways seat belts protect occupants from injuries, according to the Tennessee Department of Safety and Homeland Security.
Read More →
It’s here: The 2026 Fleet Technology Trends Report
What does AI mean for fleets? Get the answer — and learn other top tech trends.
Read More →
Small Fleets, Big Impact: How Independent Drivers Power Wreaths Across America
Check out how small fleets and independent drivers power Wreaths Across America each December and why their impact matters more than ever.
Read More →
VMS Survey Finds 65% of Small Fleet Managers Run Operations Alone
A new VMS survey shows small fleet managers are stretched thin, with most handling operations solo and eager to adopt digital tools for relief.
Read More →
Tips for Driving Safely on Halloween Night
This video features a reminder from the Connecticut Department of Transportation (DOT) and the Connecticut Police Chiefs Association, urging drivers to prioritize safety this Halloween.
Read More →
AI, Access, and Uptime: VMS’s Next Chapter with David Prusinski
VMS’s new Co-CEO, David Prusinski, shares how an AI-first approach will give small fleets and repair shops the tools to compete like big players.
Read More →