

Honolulu, Los Angeles and San Francisco Top 3 Worst Traffic Cities
In the first worldwide report to analyze traffic congestion, which was released by INRIX, 70 of America’s Top 100 Most Populated Cities showed decreases in traffic congestion last year. Honolulu is the worst traffic city with drivers spending an average of 58 hours in traffic annually.
Traffic congestion in the U.S. dropped 30% in 2011, according to an annual report, which cites high unemployment and high fuel prices as contributing factors. Honolulu was shown to have the worst traffic, with drivers wasting 58 hours in gridlock last year.
In the first worldwide report to analyze traffic congestion, which was released by INRIX, 70 of America’s Top 100 Most Populated Cities showed decreases in traffic congestion last year. The drop in U.S. traffic congestion in 2011 follows two years of modest increases in 2009 (1%) and 2010 (10%). The last time America experienced a similar decline was 2008, when traffic congestion plummeted 34%.
By analyzing traffic (data over the course of a year) in the nation’s 100 largest metropolitan areas in 2011, the Top 10 Worst U.S. Traffic Cities are:
Honolulu: Drivers waste 58 hours in traffic; Worst Hour = Tuesday from 5:15 – 5:30pm.
Los Angeles: Drivers waste 56 hours in traffic; Worst Hour = Thursday from 5:45 – 6:00pm.
San Francisco: Drivers waste 48 hours in traffic; Worst Hour = Thursday from 5:45 – 6:00pm.
New York: Drivers waste 57 hours in traffic; Worst Hour = Friday from 5:30 – 5:45pm.
Bridgeport, Conn.: Drivers waste 42 hours in traffic; Worst Hour = Friday from 5:30 – 5:45pm.
Washington, D.C.: Drivers waste 45 hours in traffic; Worst Hour = Thursday from 5:45 – 6:00pm.
Seattle: Drivers waste 33 hours in traffic; Worst Hour = Thursday from 5:30 – 5:45pm.
Austin, Texas: Drivers waste 30 hours in traffic; Worst Hour = Thursday from 5:30 – 5:45pm.
Boston: Drivers waste 35 hours in traffic; Worst Hour = Thursday from 5:30 – 5:45pm.
Chicago: Drivers waste 36 hours in traffic2; Worst Hour = Thursday from 5:30 – 5:45pm.
U.S. Traffic Patterns & Worst Traffic Corridors
Nationwide, Americans traveling the nation’s worst traffic corridors experience up to 60 hours of delay annually on their afternoon commutes alone. Of the 162 corridors of at least three miles in length that experience heavy traffic congestion every day, the Top 10 Worst U.S. Traffic Corridors are:
Los Angeles: A 13-mile stretch of the San Diego Fwy/I-405 NB from I-105/Imperial Hwy interchange through the Getty Center Dr. exit that takes 33 minutes on average, with 20 minutes of delay.
New York: A 16-mile stretch of the Long Island Expy/I-495 EB from the Maurice Ave. exit to Minneola Ave./Willis Ave. exit that takes 39 minutes on average, with 22 minutes of delay.
Los Angeles: A 15-mile stretch of the Santa Monica Fwy/I-10 EB from CA-1/Lincoln Blvd. exit to Alameda St. that takes 35 minutes on average, with 20 minutes of delay.
New York: An intense three-mile stretch of I-678 NB (Van Wyck Expy) from Belt Pkwy to Main St. that takes 13 minutes on average, with 10 minutes of delay.
Los Angeles: A 17.5-mile stretch of I-5 SB (Santa Ana/Golden St Fwys) from E. Caesar Chavez Ave to Valley View Ave. exits that takes 40 minutes on average, with 22 minutes of delay.
New York: A 10-mile stretch of I-278 WB (Brooklyn Queens/Gowanus Expy) from NY-25A/Northern Blvd. to the NY-27/Prospect Expy Exits that takes 31 minutes on average, with 18 minutes of delay.
Los Angeles: An eight-mile stretch of I-405 SB (San Diego Fwy) from Nordhoff St. to Mulholland Dr. that takes 22 minutes on average, with 14 minutes of delay.
New York: A six-mile stretch of the I-678 SB (Van Wyck Expy) from Horace Harding Expy to Linden Blvd that takes 20 minutes on average, with 13 minutes of delay.
Pittsburgh: An intense three-mile stretch of Penn Lincoln Pkwy/I-376 EB from Lydia St. to the US-19 TK RT/PA-51 exit that takes 13 minutes on average with nine minutes of delay in the morning peak period.
San Francisco: An 11-mile stretch of the CA-4 EB (California Delta Hwy) from Bailey Rd to Somersville Rd. that takes 16 minutes on average, with 11 minutes of delay.
If you happen to drive any of the Top 10 Worst Corridors during rush hour you spend nearly three weeks per year stuck in traffic. Given that these are averages, it is important to note that travel times are often much worse many days of the year.
The INRIX U.S. Scorecard also takes a micro look at traffic problems all across the country — zooming in on the total hours spent in traffic, worst day of the week for commuting and average speeds for the Top 100 U.S. cities along with hundreds of other details.
Unique patterns evolving out of U.S. traffic congestion include:
Worst Traffic Day: Friday
Worst Morning Commute: Tuesday
Worst Evening Commute: Friday
Worst Hour: Friday 5 – 6 p.m.
Best Traffic Day: Monday
Best Morning Commute: Friday
Best Evening Commute: Monday
Best Hour: Friday 6 – 7 a.m.
Big Data at Work
Available for free as a public service from INRIX, the INRIX Traffic Scorecard report is the first of its kind to rank and provide detailed information on the 100 most congested U.S. metropolitan areas and the 100 worst traffic corridors nationwide. In creating the Scorecard, INRIX analyzes information for more than 300,000 miles of roads in the U.S. and 250,000 km in Europe during every hour of the day to generate the most comprehensive and timely congestion analyses available.
The Scorecard is based on analysis of billions of raw data points from INRIX’s historical traffic database of approximately 100 million vehicles traveling the roads everyday including taxis, airport shuttles, service delivery vans, long haul trucks and passenger cars. Each data report from these GPS-equipped vehicles and devices includes the speed, location and heading of a particular vehicle at a reported date and time.
More information or to see the complete Traffic Scorecard, visit: http://inrix.com/scorecard.
More Small Fleet

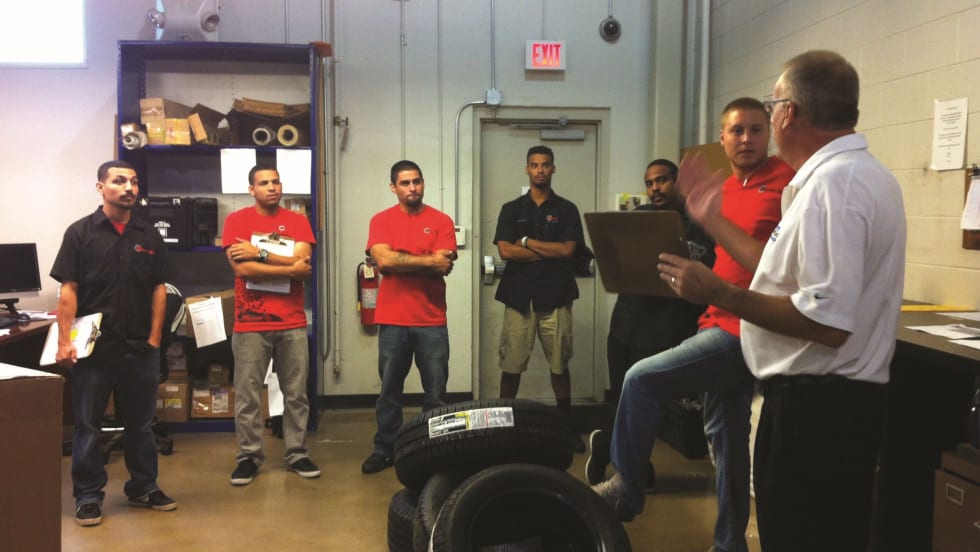
Developing Budget-Friendly Driver Safety Programs
From driver training and safety meetings to one-on-one coaching and incentive programs, several small fleets share how they have developed a safety culture with their drivers using low- to no-cost resources.
Read More →
Why Fleet Managers Are Replacing Departmental Vehicles with Shared Motor Pools
Departmentally assigned vehicles often create hidden costs through underutilization, poor visibility, and increased administrative burden. This white paper explores how shared motor pool strategies help fleets reduce costs, improve accountability, and optimize vehicle utilization.
Read More →
Boosting Last-Mile Fleet Uptime, Safety, and Value with AI Vehicle Inspections
AI-powered inspections are transforming last-mile fleets by replacing manual checks with highly accurate automated scans that detect defects in seconds. By giving fleet operations visibility into the daily condition of their vehicles, you can identify trends over the vehicle’s lifecycle that enable improved procurement decisions, route management, driver training and accountability.
Read More →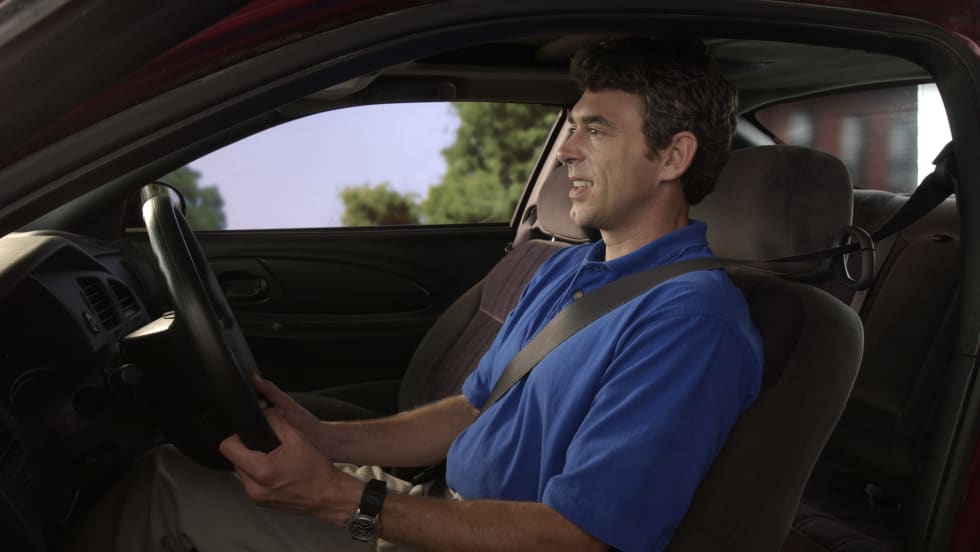
Five Ways Seat Belts Help Prevent Injuries
There are five ways seat belts protect occupants from injuries, according to the Tennessee Department of Safety and Homeland Security.
Read More →
It’s here: The 2026 Fleet Technology Trends Report
What does AI mean for fleets? Get the answer — and learn other top tech trends.
Read More →
Small Fleets, Big Impact: How Independent Drivers Power Wreaths Across America
Check out how small fleets and independent drivers power Wreaths Across America each December and why their impact matters more than ever.
Read More →
VMS Survey Finds 65% of Small Fleet Managers Run Operations Alone
A new VMS survey shows small fleet managers are stretched thin, with most handling operations solo and eager to adopt digital tools for relief.
Read More →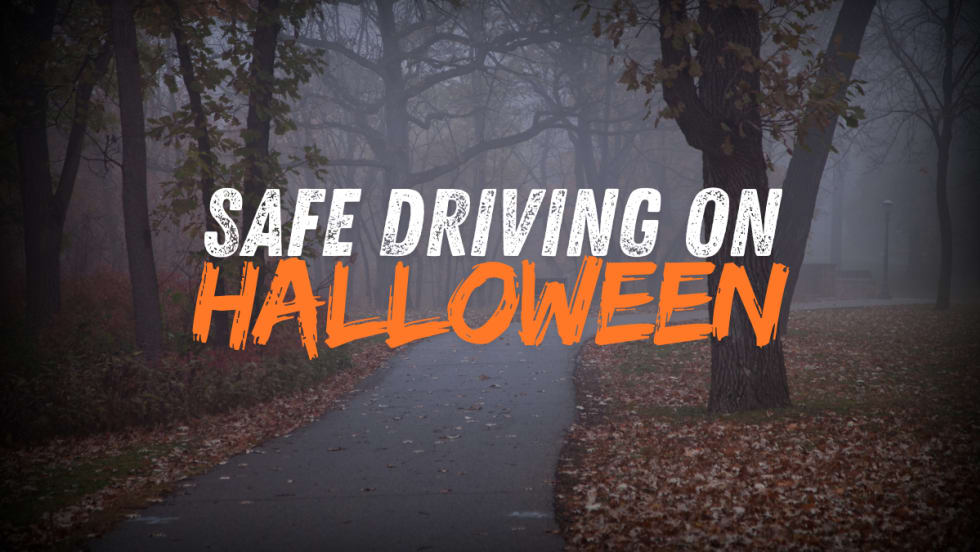
Tips for Driving Safely on Halloween Night
This video features a reminder from the Connecticut Department of Transportation (DOT) and the Connecticut Police Chiefs Association, urging drivers to prioritize safety this Halloween.
Read More →
AI, Access, and Uptime: VMS’s Next Chapter with David Prusinski
VMS’s new Co-CEO, David Prusinski, shares how an AI-first approach will give small fleets and repair shops the tools to compete like big players.
Read More →