

High Incentives Spending in April Shows Mixed Results
Edmunds.com estimated that the average automotive manufacturer incentive in the U.S. was $3,031 per vehicle sold in April 2009, down $134, or 4.2 percent, from March 2009, and up $680, or 28.9 percent, from April 2008.
Edmunds.com estimated that the average automotive manufacturer incentive in the U.S. was $3,031 per vehicle sold in April 2009, down $134, or 4.2 percent, from March 2009, and up $680, or 28.9 percent, from April 2008.
"This month's sales reports may prove that there is a point of diminishing returns for incentives spending," stated Jesse Toprak, executive director of industry analysis for Edmunds.com. "For some automakers, this month's high incentives diluted brand image and hurt residual values while delivering only a negligible lift in sales."
True Cost of Incentives for the Top Seven Automakers
Automaker | April 2009 | March 2009 | April 2008 |
Chrysler | $4,288 | $4,889 | $3,795 |
Ford | $3,636 | $3,673 | $2,989 |
General Motors | $4,063 | $4,772* | $3,132 |
Honda | $1,439 | $1,334 | $1,405 |
Hyundai | $3,591 | $3,504 | $2,156 |
Nissan | $2,779 | $2,234 | $1,796 |
Toyota | $1,648 | $1,565 | $840 |
Industry Average | $3,031 | $3,165 | $2,351 |
According to Edmunds.com, combined incentives spending for domestic manufacturers averaged $3,959 per vehicle sold in April 2009, down from $4,465 in March 2009. From March 2009 to April 2009, European automakers increased incentives spending by $26 to $3,410 per vehicle sold; Japanese automakers increased incentives spending by $132 to $1,740 per vehicle sold; and Korean automakers increased incentives spending by $87 to $3,591 per vehicle sold.
[PAGEBREAK]
In April 2009, the industry's aggregate incentive spending is estimated to have totaled approximately $2.6 billion, down 3.8 percent from March 2009. Chrysler, Ford and General Motors spent an aggregate of $1.5 billion, or 59.5 percent of the total; Japanese manufacturers spent $575 million, or 22.1 percent; European manufacturers spent $257 million, or 9.9 percent; and Korean manufacturers spent $221 million, or 8.5 percent.
"Despite earning little return in the way of higher sales on their incentive investments, automakers seem to be playing a game of chicken - all are waiting for the other guy to drop back first," commented Edmunds' AutoObserver.com senior editor Michelle Krebs. "Automakers appear to fear the bottom falling out completely if they back down on incentives."
Among vehicle segments, premium sport cars had the highest average incentives, $6,540 per vehicle sold, followed by large SUVs at $4,797. Subcompact cars had the lowest average incentives per vehicle sold, $1060, followed by compact cars at $1,893. Analysis of incentives expenditures as a percentage of average sticker price for each segment shows large car averaged the highest, 14.0 percent, followed by large trucks at 13.0 percent of sticker price. Premium luxury cars averaged the lowest with 4.5 percent and subcompact cars followed with 6.7 percent of sticker price.
Comparing all brands, in April Scion spent the least, $160 per vehicle sold, followed by Subaru at $884. At the other end of the spectrum, Cadillac spent the most, $5,675 per vehicle sold, followed by Infiniti at $5,504. Relative to their vehicle prices, Kia and Mercury spent the most, 20.9 percent and 16.2 percent of sticker price, respectively; while Scion spent 0.9 and Lexus spent 3.3 percent.
More Small Fleet

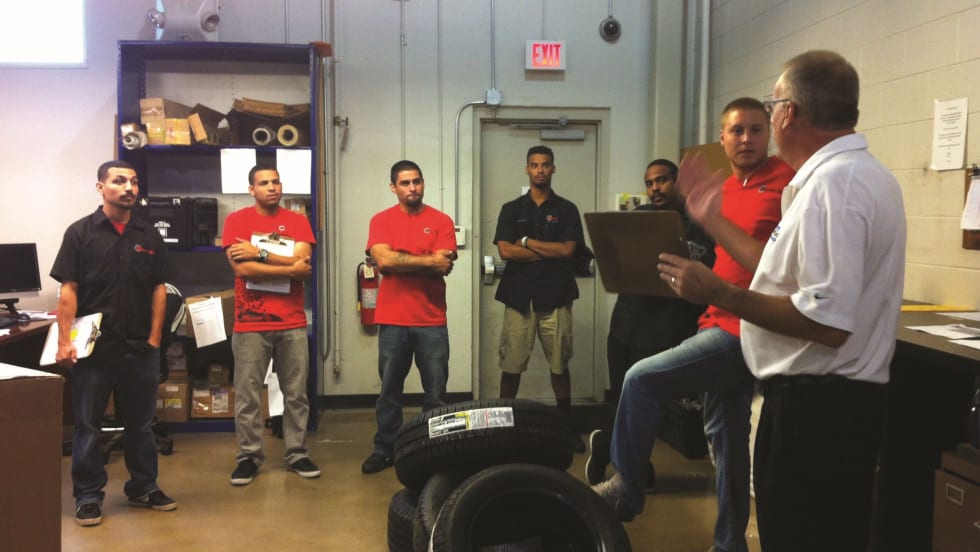
Developing Budget-Friendly Driver Safety Programs
From driver training and safety meetings to one-on-one coaching and incentive programs, several small fleets share how they have developed a safety culture with their drivers using low- to no-cost resources.
Read More →
Why Fleet Managers Are Replacing Departmental Vehicles with Shared Motor Pools
Departmentally assigned vehicles often create hidden costs through underutilization, poor visibility, and increased administrative burden. This white paper explores how shared motor pool strategies help fleets reduce costs, improve accountability, and optimize vehicle utilization.
Read More →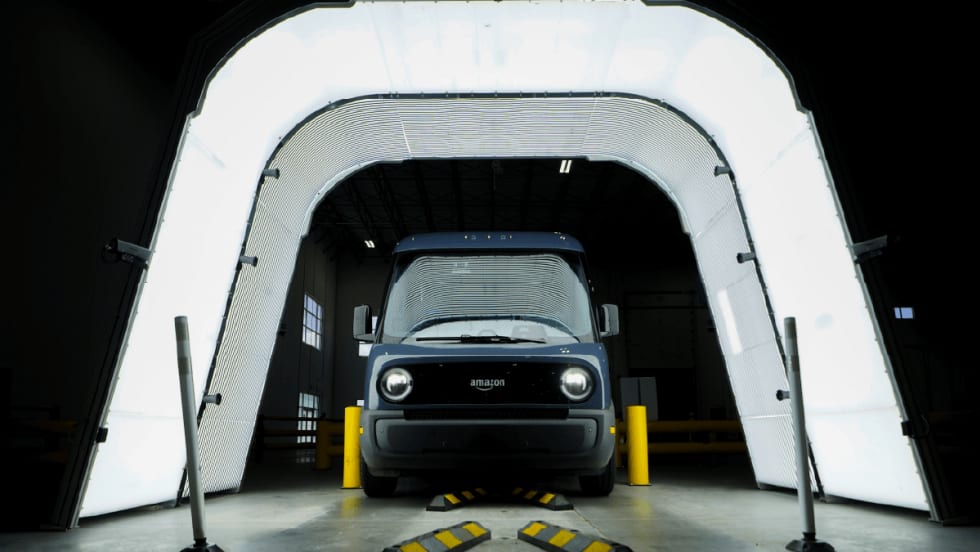
Boosting Last-Mile Fleet Uptime, Safety, and Value with AI Vehicle Inspections
AI-powered inspections are transforming last-mile fleets by replacing manual checks with highly accurate automated scans that detect defects in seconds. By giving fleet operations visibility into the daily condition of their vehicles, you can identify trends over the vehicle’s lifecycle that enable improved procurement decisions, route management, driver training and accountability.
Read More →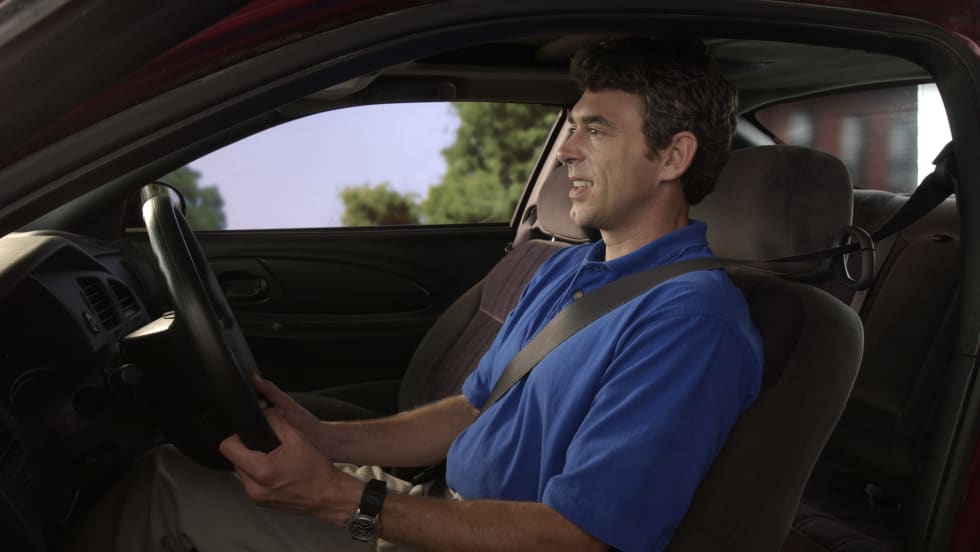
Five Ways Seat Belts Help Prevent Injuries
There are five ways seat belts protect occupants from injuries, according to the Tennessee Department of Safety and Homeland Security.
Read More →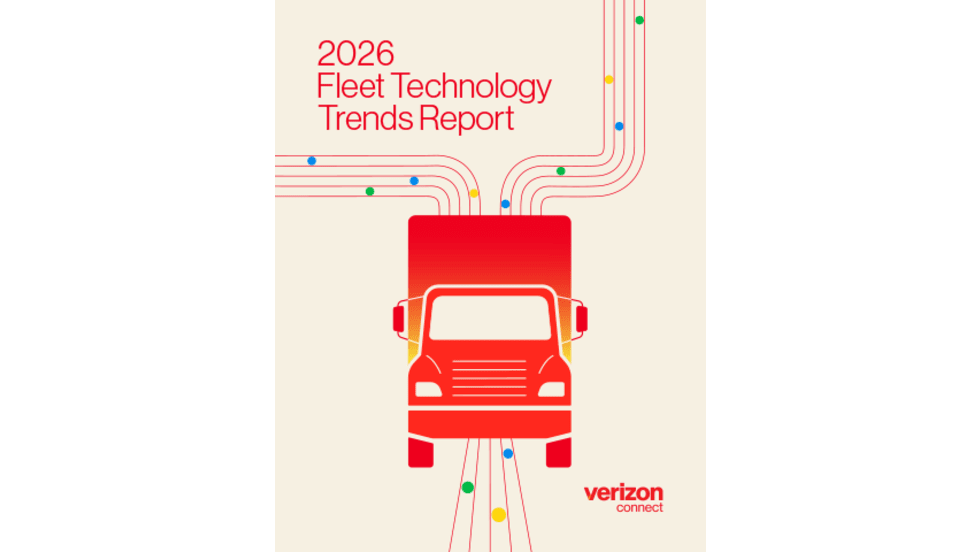
It’s here: The 2026 Fleet Technology Trends Report
What does AI mean for fleets? Get the answer — and learn other top tech trends.
Read More →
Small Fleets, Big Impact: How Independent Drivers Power Wreaths Across America
Check out how small fleets and independent drivers power Wreaths Across America each December and why their impact matters more than ever.
Read More →
VMS Survey Finds 65% of Small Fleet Managers Run Operations Alone
A new VMS survey shows small fleet managers are stretched thin, with most handling operations solo and eager to adopt digital tools for relief.
Read More →
Tips for Driving Safely on Halloween Night
This video features a reminder from the Connecticut Department of Transportation (DOT) and the Connecticut Police Chiefs Association, urging drivers to prioritize safety this Halloween.
Read More →
AI, Access, and Uptime: VMS’s Next Chapter with David Prusinski
VMS’s new Co-CEO, David Prusinski, shares how an AI-first approach will give small fleets and repair shops the tools to compete like big players.
Read More →