

GreenRoad Report Details Most Common Risky or Inefficient Maneuvers Fleet Drivers Make
GreenRoad 's 2012 Fleet Driver Performance Data Benchmark Report, analyzed safety performance data for more than 70,000 drivers worldwide.

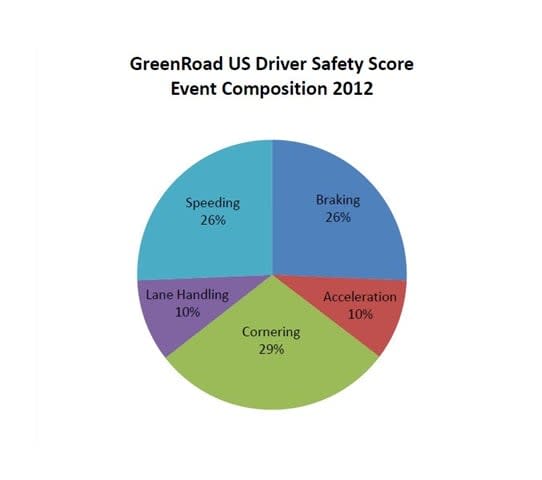
GreenRoad's 2012 Fleet Driver Performance Data Benchmark Report showed the breakdown of risky or inefficient driving manuevers across 70,000 drivers worldwide. Image courtesy GreenRoad.
GreenRoad's 2012 Fleet Driver Performance Data Benchmark Report showed the breakdown of risky or inefficient driving manuevers across 70,000 drivers worldwide. Image courtesy GreenRoad.
A new report from driver performance management services company GreenRoad provided new data about fleet drivers’ safety records and driving habits. The company’s 2012 Fleet Driver Performance Data Benchmark Report, analyzed safety performance data for more than 70,000 drivers worldwide.
To start, the report said the risky or inefficient driving events drivers most commonly make include corner handling (29%), harsh braking (26%), and speeding (26%). This is a change from 2011, where drivers' most common risky maneuver was speeding, at 40% of the total. GreenRoad attributes this change to use of its smartphone app, which provides immediate feedback.
“We believe the use of our smartphone apps have helped drivers become more aware of their risky speeding behavior and we are seeing those drivers modify their behavior, thus resulting in an evening out of the Safety Score mix for 2012,” said Karen White, senior vice president of customer solutions for GreenRoad.
Next, the report found that although there aren’t any seasonal variations in driver performance, there are variations depending on the time of day. Safety scores show small numbers (and safer driving) during the early morning, with scores as low as 2 (anything under 20 is considered “safe” driving), and as high as 9 during peak, rush-hour periods.
GreenRoad’s report also showed that drivers using GreenRoad’s service (the 70,000 drivers the company has data for) showed Safety Score improvements going from 29 to 21 in 2012, which is a 28% improvement. Also, GreenRoad said the drivers it’s monitoring improved their Safety Scores by nearly 50% within six months.
GreenRoad calculates its Safety Score based on driver performance in five categories, including braking, acceleration, corner handling, lane handling, and speeding.
You can view the full report here (requires registration).
Originally posted on Automotive Fleet
More Small Fleet

Developing Budget-Friendly Driver Safety Programs
From driver training and safety meetings to one-on-one coaching and incentive programs, several small fleets share how they have developed a safety culture with their drivers using low- to no-cost resources.
Read More →
Why Fleet Managers Are Replacing Departmental Vehicles with Shared Motor Pools
Departmentally assigned vehicles often create hidden costs through underutilization, poor visibility, and increased administrative burden. This white paper explores how shared motor pool strategies help fleets reduce costs, improve accountability, and optimize vehicle utilization.
Read More →
Boosting Last-Mile Fleet Uptime, Safety, and Value with AI Vehicle Inspections
AI-powered inspections are transforming last-mile fleets by replacing manual checks with highly accurate automated scans that detect defects in seconds. By giving fleet operations visibility into the daily condition of their vehicles, you can identify trends over the vehicle’s lifecycle that enable improved procurement decisions, route management, driver training and accountability.
Read More →
Five Ways Seat Belts Help Prevent Injuries
There are five ways seat belts protect occupants from injuries, according to the Tennessee Department of Safety and Homeland Security.
Read More →
It’s here: The 2026 Fleet Technology Trends Report
What does AI mean for fleets? Get the answer — and learn other top tech trends.
Read More →
Small Fleets, Big Impact: How Independent Drivers Power Wreaths Across America
Check out how small fleets and independent drivers power Wreaths Across America each December and why their impact matters more than ever.
Read More →
VMS Survey Finds 65% of Small Fleet Managers Run Operations Alone
A new VMS survey shows small fleet managers are stretched thin, with most handling operations solo and eager to adopt digital tools for relief.
Read More →
Tips for Driving Safely on Halloween Night
This video features a reminder from the Connecticut Department of Transportation (DOT) and the Connecticut Police Chiefs Association, urging drivers to prioritize safety this Halloween.
Read More →
AI, Access, and Uptime: VMS’s Next Chapter with David Prusinski
VMS’s new Co-CEO, David Prusinski, shares how an AI-first approach will give small fleets and repair shops the tools to compete like big players.
Read More →