

Brownsville, Texas, Named Safest-Driving City
Other cities making Allstate’s annual safest-driving list include Kansas City, Madison, Cape Coral and Boise.
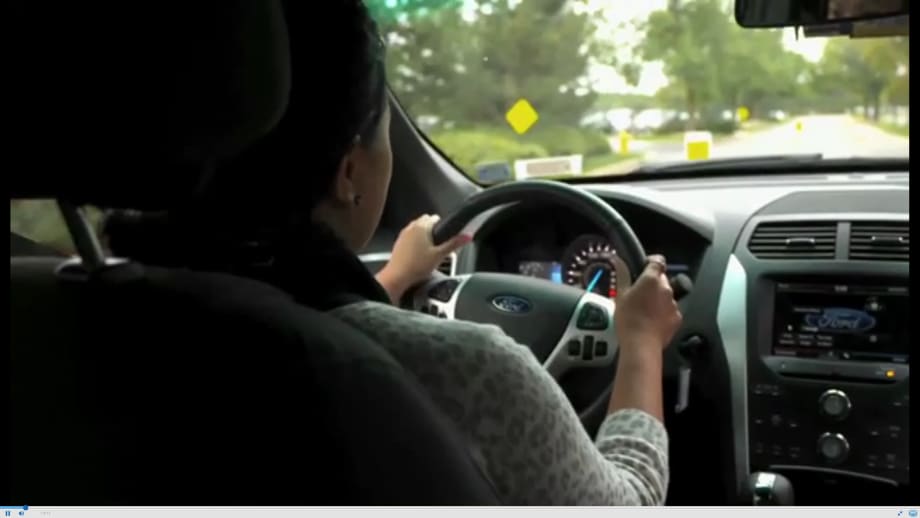
Screen shot courtesy of Allstate.
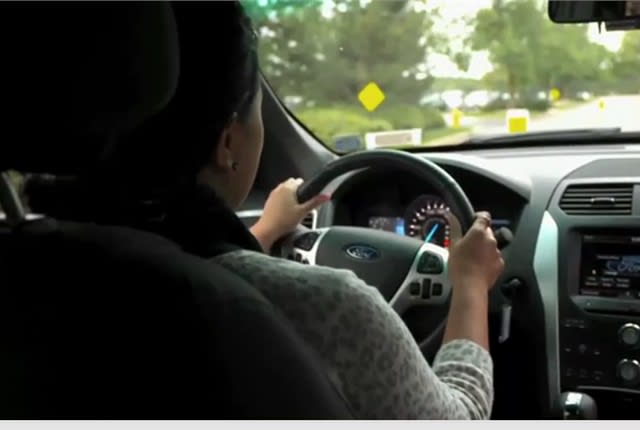
Screen shot courtesy of Allstate.
Allstate’s annual America’s Best Drivers Report has identified Brownsville, Texas, as the safest-driving city in the country.
Based on Allstate Insurance Co. claims data, the 12th annual report measures vehicle collision frequency in America’s 200 largest cities to determine which ones have the safest drivers. The average driver in Brownsville, Texas, experiences an auto collision every 14.6 years, which is 31.4% less often than the national average of every 10 years.
Also cracking the Top 10 list of safest-driving cities are Kansas City, Kan.; Madison, Wis.; Cape Coral, Fla.; Boise, Idaho; Huntsville, Ala.; Port Saint Lucie, Fla.; Wichita, Kan.; Olathe, Kan.; and Reno, Nev.
The bottom 10, or least safest-driving cities, are Boston; Worcester, Mass.; Baltimore; Washington, D.C.; Springfield, Mass.; Glendale, Calif.; Providence, R.I.; Los Angeles; Philadelphia; and San Francisco.
“With millions of drivers expected to hit the roads nationwide during the July 4th weekend, our report demonstrates the importance of always putting safety first,” said Glenn Shapiro, executive vice president of claims for Allstate.
National safety experts say drivers are now spending more time on the road and suffering more fatal collisions than in recent years. The U.S. Department of Transportation reports that from March 2015 to February 2016, Americans drove 3.15 trillion miles — an increase of more than 3% over the previous 12 months and the largest year-to-year increase in more than two decades.
According to the National Safety Council, more than 38,000 roadway fatalities occurred last year — the highest count since 2008. Preventable human factors — such as drunk, distracted or drowsy driving; speeding; and failure to use safety features — contribute to 94% of car crashes.
According to the Insurance Institute for Highway Safety, intoxication is a significant factor in Fourth of July crash fatalities, with 42% between 2010 and 2014 involving at least one driver with a blood-alcohol concentration over the legal driving limit of .08.
“While July Fourth is consistently the deadliest day on the road, the toll of crash deaths goes on every day, all year long,” said Adrian Lund, president of IIHS. “If everyone buckles up, avoids distractions, obeys the speed limit and doesn’t drink and drive, we can make July Fourth and every day on the road a lot safer.”
The following are the top 10 safest driving cities, according to Allstate’s 2016 America’s Best Drivers Report:
City & Overall Ranking | Collision Likelihood Compared to National Average | Average Years Between Collisions |
1. Brownsville, Texas | 31.4% less likely | 14.6 |
2. Kansas City, Kan. | 26.3% less likely | 13.6 |
3. Madison, Wis. | 24.7% less likely | 13.3 |
4. Cape Coral, Fla. | 22.3% less likely | 12.9 |
5. Boise, Idaho | 22.1% less likely | 12.8 |
6. Huntsville, Ala. | 21.4% less likely | 12.7 |
7. Port Saint Lucie, Fla. | 20.1% less likely | 12.5 |
8. Wichita, Kan. | 19.7% less likely | 12.5 |
9. Olathe, Kan. | 19.6% less likely | 12.4 |
10. Reno, Nev. | 18.3% less likely | 12.2 |
Click here for an interactive map showing this year’s findings and for historical collision-frequency rankings from the past 11 years.
The report defines a collision as any auto crash resulting in a property damage claim. Allstate’s auto policies represent nearly 10% of all U.S. auto policies, making this report a realistic snapshot of what’s happening on America’s roadways, the company said.
For the second straight year, the report also provides insight into braking habits in more than 100 cities across the country, using hard-braking data culled from Allstate’s Drivewise offering.
A hard-braking event is defined as slowing down eight miles per hour or more over a one-second period. Allstate found a correlation between hard braking and collision frequency. Cities with higher collision frequency also recorded more hard-braking events.
Nationally, on average, a driver will experience 19 hard-braking events for every 1,000 miles driven. The following are the cities with drivers who experience the fewest hard-braking events per 1,000 miles driven:
Drivewise Hard-Braking Events
(Cities’ drivers with the fewest events per 1,000 miles)
Madison, Wis.
9.0
Anchorage, Alaska
9.3
Honolulu, Hawaii
10.1
Des Moines, Iowa
10.5
Wichita, Kan.
11.1
Boise, Idaho
11.6
Lincoln, Neb.
11.7
Kansas City, Kan.
12.0
Chesapeake, Va.
12.2
Jackson, Miss.
12.2
Driving tips for cities with high braking activity:
Leave room between you and other vehicles. Hard-braking collisions can occur when drivers are following other cars too closely, causing a rear-end collision. Try to avoid rear-end collisions by leaving more space and time to react to other vehicles’ actions.
Minimize distractions while driving. Distracted driving is one of the main causes of collisions. Common driving distractions include eating, grooming, talking on a cell phone or texting, interacting with other passengers, adjusting navigation devices, and playing loud music.
To download the full report, click here.
Originally posted on Automotive Fleet
More Small Fleet

Why Fleet Managers Are Replacing Departmental Vehicles with Shared Motor Pools
Departmentally assigned vehicles often create hidden costs through underutilization, poor visibility, and increased administrative burden. This white paper explores how shared motor pool strategies help fleets reduce costs, improve accountability, and optimize vehicle utilization.
Read More →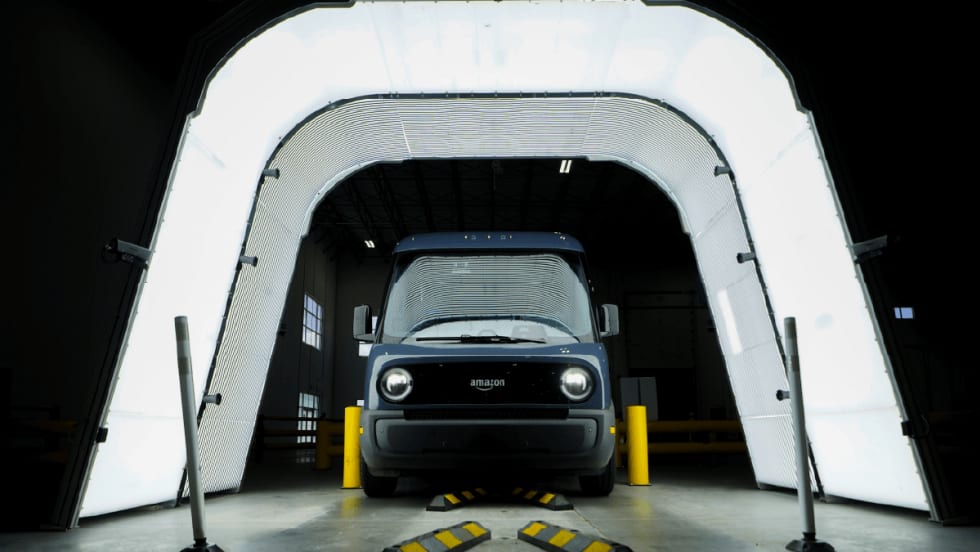
Boosting Last-Mile Fleet Uptime, Safety, and Value with AI Vehicle Inspections
AI-powered inspections are transforming last-mile fleets by replacing manual checks with highly accurate automated scans that detect defects in seconds. By giving fleet operations visibility into the daily condition of their vehicles, you can identify trends over the vehicle’s lifecycle that enable improved procurement decisions, route management, driver training and accountability.
Read More →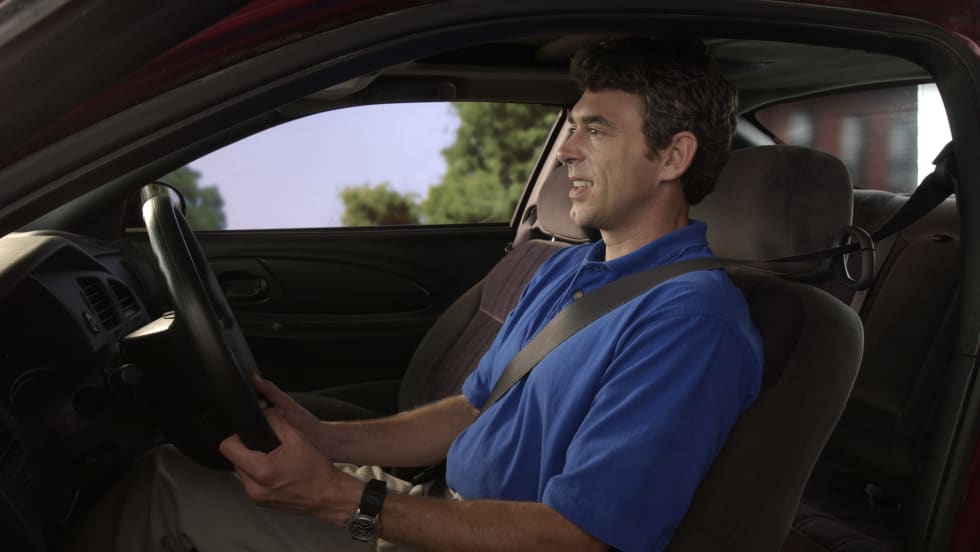
Five Ways Seat Belts Help Prevent Injuries
There are five ways seat belts protect occupants from injuries, according to the Tennessee Department of Safety and Homeland Security.
Read More →
It’s here: The 2026 Fleet Technology Trends Report
What does AI mean for fleets? Get the answer — and learn other top tech trends.
Read More →
Small Fleets, Big Impact: How Independent Drivers Power Wreaths Across America
Check out how small fleets and independent drivers power Wreaths Across America each December and why their impact matters more than ever.
Read More →
VMS Survey Finds 65% of Small Fleet Managers Run Operations Alone
A new VMS survey shows small fleet managers are stretched thin, with most handling operations solo and eager to adopt digital tools for relief.
Read More →
Tips for Driving Safely on Halloween Night
This video features a reminder from the Connecticut Department of Transportation (DOT) and the Connecticut Police Chiefs Association, urging drivers to prioritize safety this Halloween.
Read More →
AI, Access, and Uptime: VMS’s Next Chapter with David Prusinski
VMS’s new Co-CEO, David Prusinski, shares how an AI-first approach will give small fleets and repair shops the tools to compete like big players.
Read More →
Fleet Managers Share Winter Prep Tips: It's Never Too Early!
Three fleets share best practices to prep vehicles for winter and prevent downtime when the cold sets in.
Read More →
Hot Weather Driving Tips for Fleet Drivers
As we head into another potentially extreme summer season, the risks for fleet drivers remain high, from engine strain and tire blowouts to unpredictable traffic patterns. An expert shares advice on how fleet drivers can boost their safety during the steamy summer months.
Read More →