

Albuquerque No. 1 in Auto Theft Rate
The latest Hot Spots vehicle theft report from the National Insurance Crime Bureau also reveals that Anchorage, Alaska and Billings, Mont. are newcomers to the top 10 list.


Photo: Bobit
The greater Albuquerque, N.M. metropolitan area had the highest per-capital auto theft rate in 2016, according to a new report from the National Insurance Crime Bureau (NICB).
In 2015, Albuquerque ranked second, behind Modesto, Calif., in auto theft rate. Last year, six of the top 10 metropolitan statistical areas in vehicle theft rate were in California.
Hot Spots, a report that NICB releases annually, examines vehicle theft data collected by the National Crime Information Center for each of the nation’s metropolitan statistical areas. These statistical areas, designated by the Office of Management and Budget, often include population centers much larger than the cities for which they’re named. For example, the Albuquerque metropolitan statistical area includes the entire county of Bernalillo, not just the area within Albuquerque city limits.
New to the top 10 this year is Anchorage, Alaska (No. 6) and Billings, Mont. (No. 10). As a population-based survey, an area with a much smaller population and a moderate number of thefts can — and often does — have a higher theft rate than an area with a much more significant vehicle theft problem and a larger population to absorb it, NICB explained. This is how Billings, with 877 auto thefts, placed 10th while Los Angeles, with 60,670 thefts, placed 35th.
For 2016, the 10 metropolitan statistical areas with the highest vehicle theft rates were:
Albuquerque, N.M. (10,011 thefts in 2016, up from 6,657 in 2015)
Pueblo, Colo. (1,325 thefts in 2016, up from 983 in 2015)
Bakersfield, Calif. (7,176 thefts in 2016, up from 6,000 in 2015)
Modesto, Calif. (3,820 thefts in 2016, down from 4,072 in 2015)
Riverside-San Bernardino-Ontario, Calif. (25,708 in 2016, up from 25,001 in 2015)
Anchorage, Alaska (2,273 in 2016, up from 1,359 in 2015)
Merced, Calif. (1,605 in 2016, up from 1,132 in 2015)
San Francisco-Oakland-Hayward, Calif. (29,414 in 2016, down from 30,554 in 2015)
Fresno, Calif. (5,682 in 2016, up from 5,149 in 2015)
Billings, Mont. (877 in 2016, up from 775 in 2015)
To learn how your area ranks, click here.
Each year, the FBI releases preliminary Uniform Crime Report data for the previous year’s January-June time frame. When the preliminary 2016 crime data was released earlier this year, vehicle theft was up 6.6% across the nation. This increase is reflected in the Hot Spots report and is expected to hold when the final data is published in the fall, NICB said.
For comparison, below is a table showing the preliminary Uniform Crime Report vehicle theft data, the percent change from the previous year, and the final Uniform Crime Report vehicle theft figure:
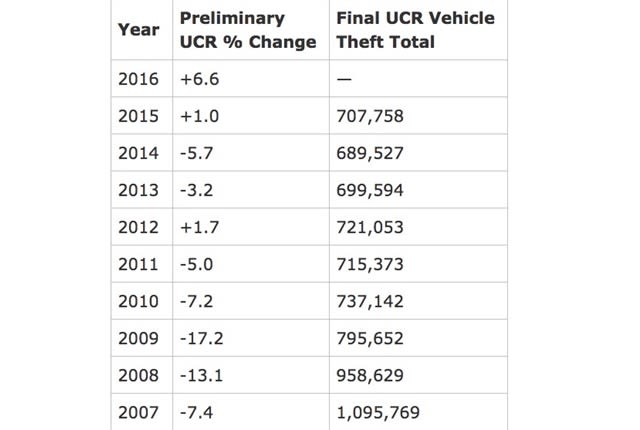
Source: NICB
The historic peak year for vehicle theft was 1991, when there were more than 1.6 million reported thefts. In 2015, the total was 707,758 — a 57.4% reduction since 1991.
"While the final result for 2016 is expected to be higher than 2015's number, the vehicle theft environment across the country is vastly improved from the 1990s," NICB said in the organization's released statement about the Hot Spots report.
Originally posted on Automotive Fleet
More Small Fleet

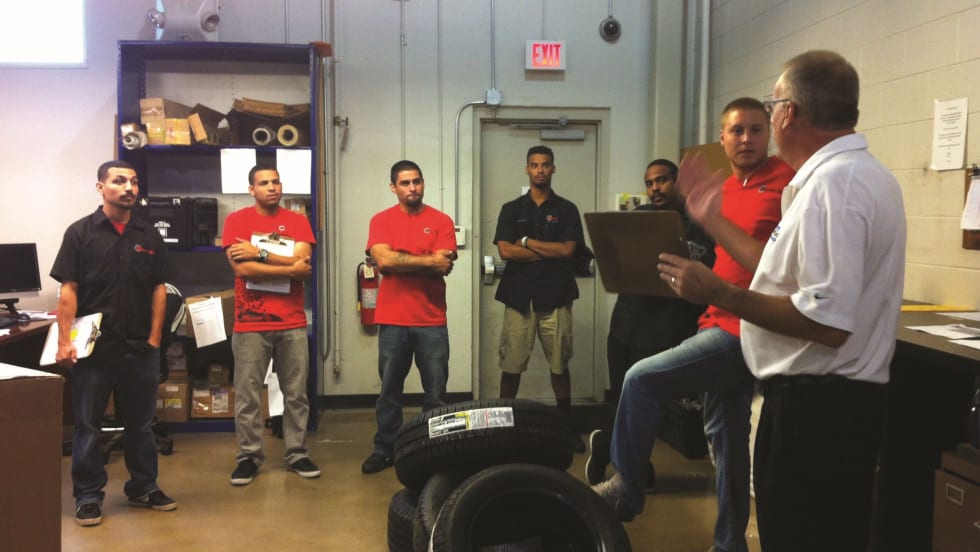
Developing Budget-Friendly Driver Safety Programs
From driver training and safety meetings to one-on-one coaching and incentive programs, several small fleets share how they have developed a safety culture with their drivers using low- to no-cost resources.
Read More →
Why Fleet Managers Are Replacing Departmental Vehicles with Shared Motor Pools
Departmentally assigned vehicles often create hidden costs through underutilization, poor visibility, and increased administrative burden. This white paper explores how shared motor pool strategies help fleets reduce costs, improve accountability, and optimize vehicle utilization.
Read More →
Boosting Last-Mile Fleet Uptime, Safety, and Value with AI Vehicle Inspections
AI-powered inspections are transforming last-mile fleets by replacing manual checks with highly accurate automated scans that detect defects in seconds. By giving fleet operations visibility into the daily condition of their vehicles, you can identify trends over the vehicle’s lifecycle that enable improved procurement decisions, route management, driver training and accountability.
Read More →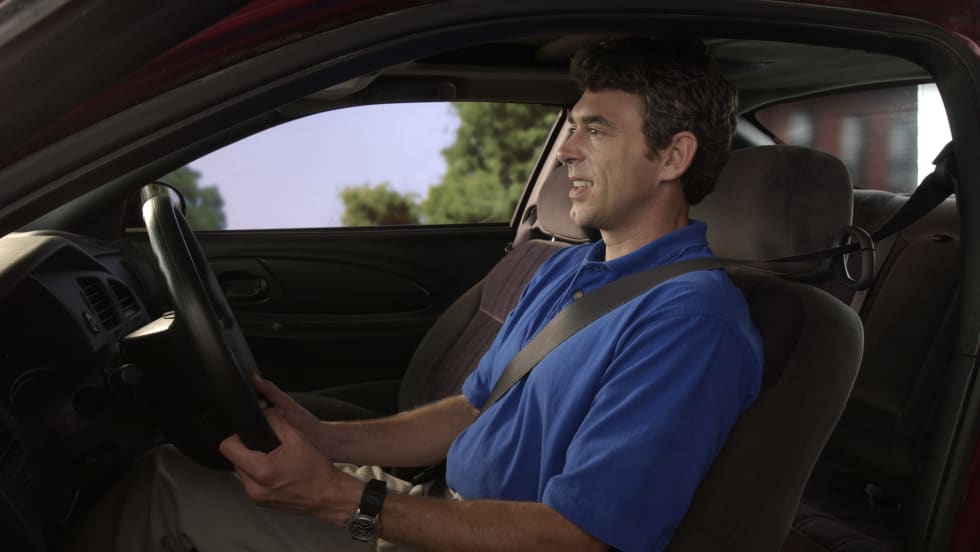
Five Ways Seat Belts Help Prevent Injuries
There are five ways seat belts protect occupants from injuries, according to the Tennessee Department of Safety and Homeland Security.
Read More →
It’s here: The 2026 Fleet Technology Trends Report
What does AI mean for fleets? Get the answer — and learn other top tech trends.
Read More →
Small Fleets, Big Impact: How Independent Drivers Power Wreaths Across America
Check out how small fleets and independent drivers power Wreaths Across America each December and why their impact matters more than ever.
Read More →
VMS Survey Finds 65% of Small Fleet Managers Run Operations Alone
A new VMS survey shows small fleet managers are stretched thin, with most handling operations solo and eager to adopt digital tools for relief.
Read More →
Tips for Driving Safely on Halloween Night
This video features a reminder from the Connecticut Department of Transportation (DOT) and the Connecticut Police Chiefs Association, urging drivers to prioritize safety this Halloween.
Read More →
AI, Access, and Uptime: VMS’s Next Chapter with David Prusinski
VMS’s new Co-CEO, David Prusinski, shares how an AI-first approach will give small fleets and repair shops the tools to compete like big players.
Read More →