

11% of Drivers Distracted, Study Finds
The Ohio-based research project also concludes that drivers 26 to 40 years old are the most likely to drive distracted.

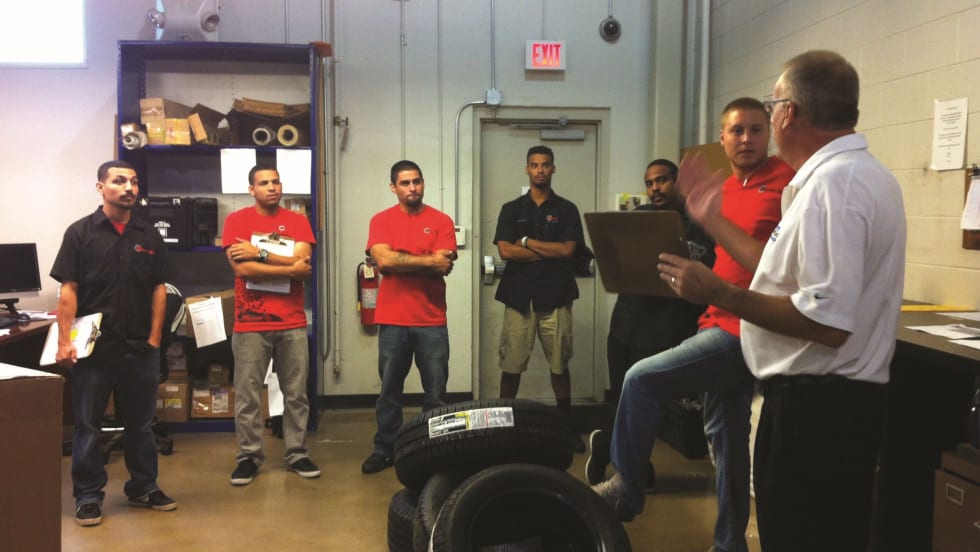
Photo courtesy of the National Highway Traffic Safety Administration.

Photo courtesy of the National Highway Traffic Safety Administration.
A total of 11% of drivers are distracted behind the wheel, with cell phones representing the majority of distractions, according to a newly updated study conducted in Ohio’s Mahoning Valley.
The research findings, released by the Eastgate Regional Council of Governments in Youngstown, Ohio, are based on data gathered in the field by staff. Two staff members were stationed for two hours at 12 different Mahoning Valley locations known for moderate to heavy traffic. The ongoing study, which began in October 2015, relies on observational methodology rather than self-reported survey results.
Among the observable distractions, use of a handheld phone — either up to the driver’s ear or held out in front — is the most common (53%). Use of a device with one hand while not focused on the road (32%) comes in second, followed by eating or drinking while driving (12%). Such distractions as searching the car, reading (including maps) and having a dog on the driver’s lap are bundled into a separate category known as “other” (4%).
Drivers in the 26-40 age group are at the highest risk for driving distracted, the study found. A total of 16% of the drivers in this age group were judged as distracted.
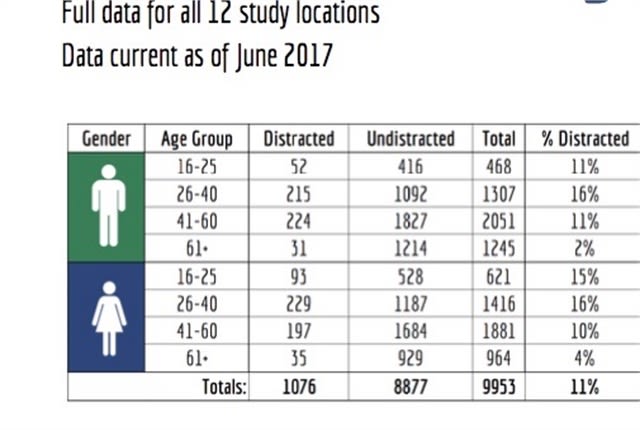
Table courtesy of Eastgate Regional Council of Governments.
Staff members recording the data designate each observed driver into one of four age groups and indicate gender. Of course, this aspect of the study has its limits; assessing a driver’s age based on a brief glance at a moving vehicle is subject to mistakes. The age groups are 16-25, 26-40, 41-60, and 60 and over.
The goal of the study is to provide results to local safety groups and communities to assist with safety outreach efforts. Eastgate Regional Council of Governments periodically releases fact sheets with updated information to augment the initial study summary released in May 2016.
To download the newly released fact sheets, which include 2017 data from four new locations, click here.
To download the initial study released in May 2016, click here.
Originally posted on Automotive Fleet
More Small Fleet

Developing Budget-Friendly Driver Safety Programs
From driver training and safety meetings to one-on-one coaching and incentive programs, several small fleets share how they have developed a safety culture with their drivers using low- to no-cost resources.
Read More →
Why Fleet Managers Are Replacing Departmental Vehicles with Shared Motor Pools
Departmentally assigned vehicles often create hidden costs through underutilization, poor visibility, and increased administrative burden. This white paper explores how shared motor pool strategies help fleets reduce costs, improve accountability, and optimize vehicle utilization.
Read More →
Boosting Last-Mile Fleet Uptime, Safety, and Value with AI Vehicle Inspections
AI-powered inspections are transforming last-mile fleets by replacing manual checks with highly accurate automated scans that detect defects in seconds. By giving fleet operations visibility into the daily condition of their vehicles, you can identify trends over the vehicle’s lifecycle that enable improved procurement decisions, route management, driver training and accountability.
Read More →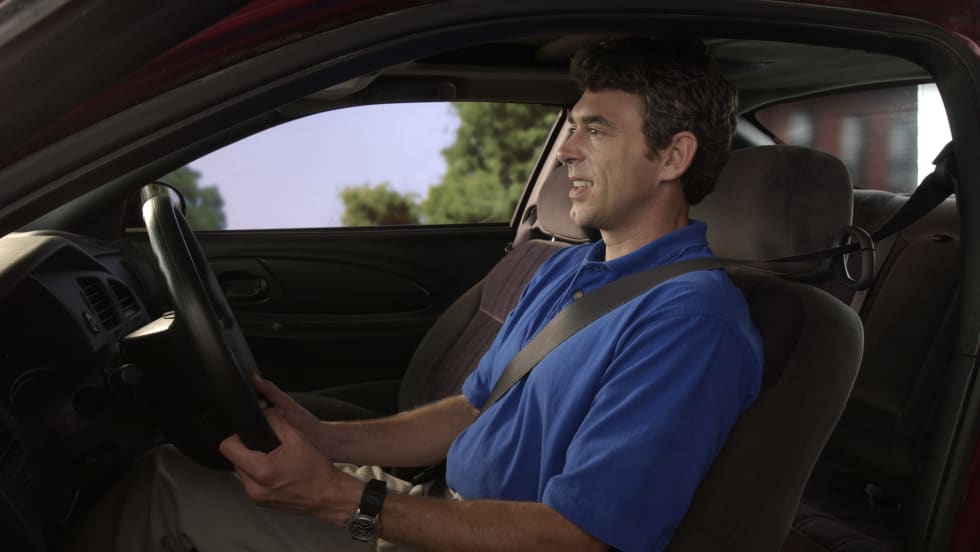
Five Ways Seat Belts Help Prevent Injuries
There are five ways seat belts protect occupants from injuries, according to the Tennessee Department of Safety and Homeland Security.
Read More →
It’s here: The 2026 Fleet Technology Trends Report
What does AI mean for fleets? Get the answer — and learn other top tech trends.
Read More →
Small Fleets, Big Impact: How Independent Drivers Power Wreaths Across America
Check out how small fleets and independent drivers power Wreaths Across America each December and why their impact matters more than ever.
Read More →
VMS Survey Finds 65% of Small Fleet Managers Run Operations Alone
A new VMS survey shows small fleet managers are stretched thin, with most handling operations solo and eager to adopt digital tools for relief.
Read More →
Tips for Driving Safely on Halloween Night
This video features a reminder from the Connecticut Department of Transportation (DOT) and the Connecticut Police Chiefs Association, urging drivers to prioritize safety this Halloween.
Read More →
AI, Access, and Uptime: VMS’s Next Chapter with David Prusinski
VMS’s new Co-CEO, David Prusinski, shares how an AI-first approach will give small fleets and repair shops the tools to compete like big players.
Read More →