

2020 Fleet Statistics: Logistics, Cass Truckload, Spot Market Rates
January 28, 2021
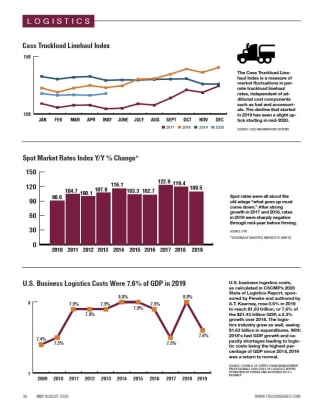

The Cass Truckload Linehaul Index is a measure of market fluctuations in per-mile truckload linehaul rates, independent of additional cost components such as fuel and accessorials. The decline that started in 2019 has seen a slight uptick starting in mid-2020.
Spot rates were all about the old adage “what goes up must come down.” After strong growth in 2017 and 2018, rates in 2019 were sharply negative through mid-year before firming.
U.S. business logistics costs, as calculated in CSCMP’s 2020 State of Logistics Report, sponsored by Penske and authored by A.T. Kearney, rose 0.6% in 2019 to reach $1.63 trillion, or 7.6% of the $21.43 trillion GDP, a 2.3% growth over 2018. The logistics industry grew as well, seeing $1.63 billion in expenditures. With 2018's fast GDP growth and capacity shortages leading to logistic costs being the highest percentage of GDP since 2018, 2019 was a return to normal.