

Study: U.S. Cities and Average Number of Hours Stuck in Traffic
Researchers say the 2005 Urban Mobility Study shows that the current pace of transportation improvement is not sufficient to keep pace with even a slow growth in travel demands in most major urban areas.
The 2005 Urban Mobility Study released in early May by the Texas Transportation Institute shows that the annual delay per peak traveler in 2003 was 47 hours. In 1993, the annual delay was 40 hours. In 1982 the annual delay was 16 hours. Researchers say the 2005 study shows that the current pace of transportation improvement is not sufficient to keep pace with even a slow growth in travel demands in most major urban areas. Annual delay per peak traveler (hours) 1982: 16, 1993: 40, 2002: 47, 2003: 47 Number of urban areas with more than 20 hours of delay per peak traveler 1982: 5, 1993: 37, 2002: 50, 2003: 51 Annual Delay per Traveler, Urban Area, Hours, 2003: Very Large Average 61 (13 areas) Los Angeles-Long Beach-Santa Ana, CA 93 San Francisco-Oakland, CA 72 Washington, DC-VA-MD 69 Atlanta, GA 67 Houston, TX 63 Dallas-Fort Worth-Arlington, TX 60 Chicago, IL-IN 58 Detroit, MI 57 Miami, FL 51 Boston, MA-NH-RI 51 New York-Newark, NY-NJ-CT 49 Phoenix, AZ 49 Philadelphia, PA-NJ-DE-MD 38 Large Average 37 (26 areas) Riverside-San Bernardino, CA 55 Orlando, FL 55 San Jose, CA 53 San Diego, CA 52 Denver-Aurora, CO 51 Baltimore, MD 50 Seattle, WA 46 Tampa-St. Petersburg, FL 46 Minneapolis-St. Paul, MN 43 Sacramento, CA 40 Portland, OR-WA 39 Indianapolis, IN 38 St. Louis, MO-IL 35 San Antonio, TX 33 Providence, RI-MA 33 Las Vegas, NV 30 Cincinnati, OH-KY-IN 30 Columbus, OH 29 Virginia Beach, VA 26 Milwaukee, WI 23 New Orleans, LA 18 Kansas City, MO-KS 17 Pittsburgh, PA 14 Buffalo, NY 13 Oklahoma City, OK 12 Cleveland, OH 10 Medium Average 25 (30 areas) Austin, TX 51 Charlotte, NC-SC 43 Louisville, KY-IN 42 Nashville-Davidson, TN 37 Tucson, AZ 36 Jacksonville, FL 34 Oxnard-Ventura, CA 33 Memphis TN-MS-AR 33 Bridgeport-Stamford, CT-NY 32 Salt Lake City, UT 31 Albuquerque, NM 30 Raleigh-Durham, NC 27 Birmingham AL 27 Omaha NE-IA 23 Honolulu, HI 20 New Haven, CT 20 Sarasota-Bradenton, FL 19 Grand Rapids, MI 19 El Paso, TX-NM 18 Allentown-Bethlehem, PA-NJ 17 Richmond, VA 17 Hartford, CT 16 Fresno, CA 13 Albany-Schenectady, NY 13 Toledo, OH-MI 12 Tulsa, OK 12 Akron, OH 12 Dayton, OH 11 Rochester, NY 7 Springfield, MA-CT 7 Small Average 13 (16 areas) Colorado Springs, CO 27 Charleston-North Charleston, SC 25 Pensacola, FL-AL 18 Cape Coral, FL 15 Salem, OR 15 Beaumont, TX 14 Spokane, WA 10 Little Rock, AR 10 Eugene, OR 9 Boulder, CO 9 Columbia, SC 9 Laredo, TX 8 Bakersfield, CA 7 Corpus Christi, TX 7 Anchorage, AK 5 Brownsville, TX 4 Very Large Urban Areas—over 3 million population. Large Urban Areas—over 1 million and less than 3 million population. Medium Urban Areas—over 500,000 and less than 1 million population. Small Urban Areas—less than 500,000 population. Annual Delay per Traveler – Extra travel time for peak period travel during the year divided by the number of travelers who begin a trip during the peak period (6 to 9 a.m. and 4 to 7 p.m.). Free-flow speeds (60 mph on freeways and 35 mph on principal arterials) are used as the comparison threshold.
More Small Fleet

Why Fleet Managers Are Replacing Departmental Vehicles with Shared Motor Pools
Departmentally assigned vehicles often create hidden costs through underutilization, poor visibility, and increased administrative burden. This white paper explores how shared motor pool strategies help fleets reduce costs, improve accountability, and optimize vehicle utilization.
Read More →
Boosting Last-Mile Fleet Uptime, Safety, and Value with AI Vehicle Inspections
AI-powered inspections are transforming last-mile fleets by replacing manual checks with highly accurate automated scans that detect defects in seconds. By giving fleet operations visibility into the daily condition of their vehicles, you can identify trends over the vehicle’s lifecycle that enable improved procurement decisions, route management, driver training and accountability.
Read More →
Five Ways Seat Belts Help Prevent Injuries
There are five ways seat belts protect occupants from injuries, according to the Tennessee Department of Safety and Homeland Security.
Read More →
It’s here: The 2026 Fleet Technology Trends Report
What does AI mean for fleets? Get the answer — and learn other top tech trends.
Read More →
Small Fleets, Big Impact: How Independent Drivers Power Wreaths Across America
Check out how small fleets and independent drivers power Wreaths Across America each December and why their impact matters more than ever.
Read More →
VMS Survey Finds 65% of Small Fleet Managers Run Operations Alone
A new VMS survey shows small fleet managers are stretched thin, with most handling operations solo and eager to adopt digital tools for relief.
Read More →
Tips for Driving Safely on Halloween Night
This video features a reminder from the Connecticut Department of Transportation (DOT) and the Connecticut Police Chiefs Association, urging drivers to prioritize safety this Halloween.
Read More →
AI, Access, and Uptime: VMS’s Next Chapter with David Prusinski
VMS’s new Co-CEO, David Prusinski, shares how an AI-first approach will give small fleets and repair shops the tools to compete like big players.
Read More →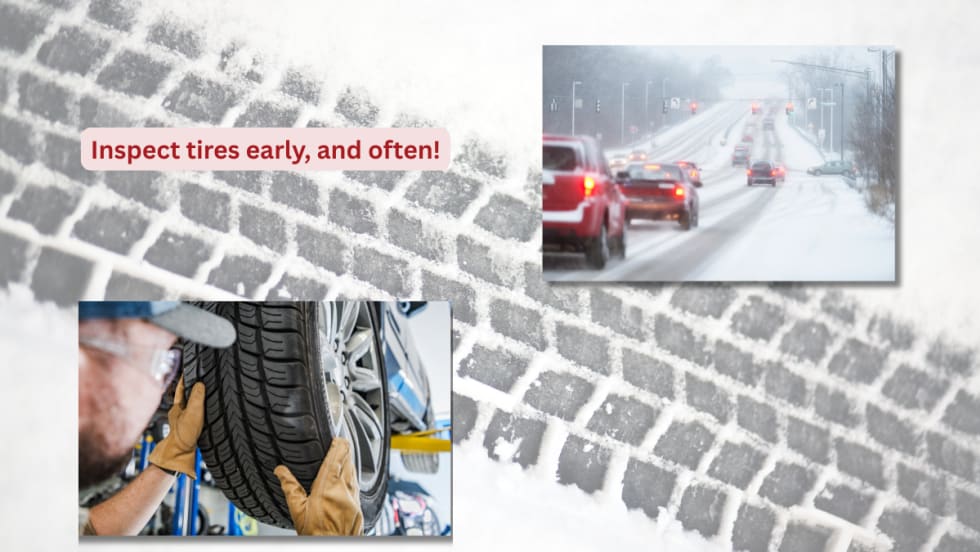
Fleet Managers Share Winter Prep Tips: It's Never Too Early!
Three fleets share best practices to prep vehicles for winter and prevent downtime when the cold sets in.
Read More →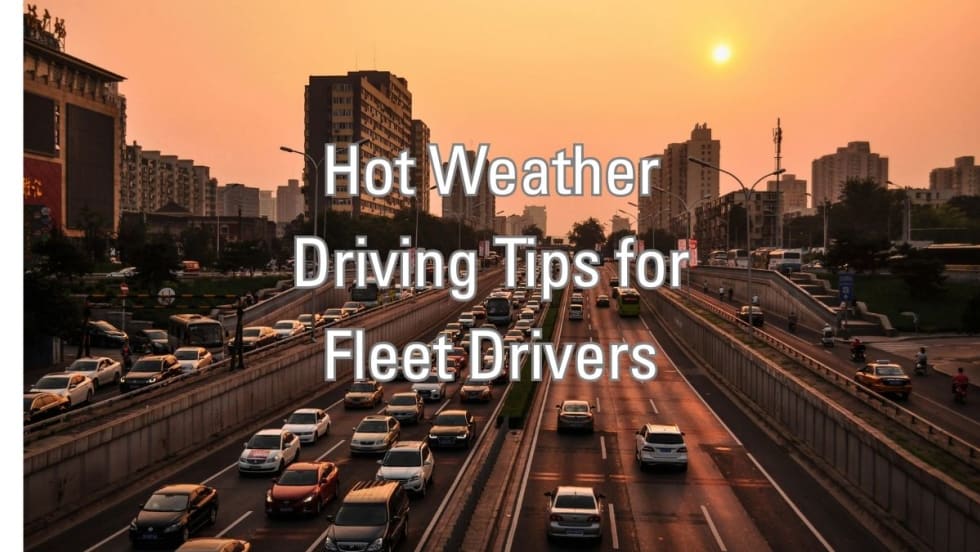
Hot Weather Driving Tips for Fleet Drivers
As we head into another potentially extreme summer season, the risks for fleet drivers remain high, from engine strain and tire blowouts to unpredictable traffic patterns. An expert shares advice on how fleet drivers can boost their safety during the steamy summer months.
Read More →